
Why Power BI? Why Consulting Companies and Power BI Consultants are so happening?
Tarsem Singh | December 31, 2020 , 7 min read
Table Of Content
Power BI is a hot topic lately, there has been a lot of noise surrounding it about how it impacts reporting and analytics. As a result, companies are increasingly building Power BI into customer-facing reports and products.
Why Power BI has an edge over other BI tools?
- Power BI is currently used by over 100,000 companies indeed. It has its presence in over 200 countries and has over 500 different partners in its ecosystem.
- It gives your organization complete control over data. Additionally, it helps in driving more valuable insights as it makes data analysis fast, accessible, and hassle-free.
- Power BI easily connects to different data sources to deliver valuable insights to your organization in just a few minutes. Also, it is collaborative, and all your employees can work together through Power BI’s flexible integrations.
Power BI provides you with updated and refreshed data, as it fetches data from hundreds of external sources. The application also enables native integrations with SQL Server, Azure, SAP, Office 365, Microsoft Dynamics, Salesforce, etc.
Struggling with Power BI Speed?

Power BI has close integration
Power BI’s close integration with Cortana helps you view real-time data simply by asking a question on the search bar. Besides, with Power BI’s real-time streaming, you can stream data and update dashboards.
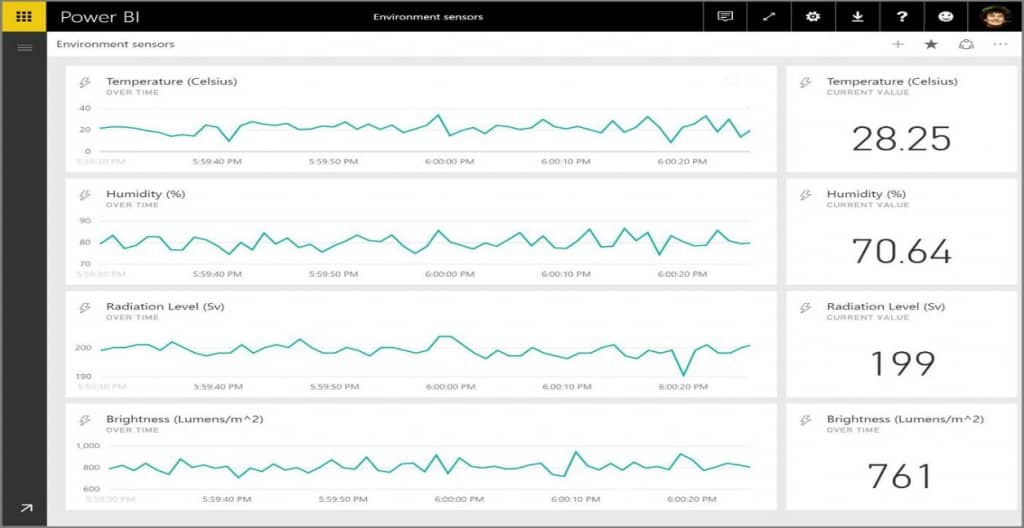
- Being collaborative, you can easily give control access permissions per user. After creating a custom dashboard/report, you can distribute to others via Power BI or through a link.
- Two of the most widely used business applications are Microsoft Excel and PowerPoint. Thus, being part of the Microsoft family, Power BI integrates seamlessly with both these applications.
- You can type a natural question in Power BI dashboard and it produces the exact data required.
- Power BI has advanced security features and secures your data with the additional benefit of Microsoft’s Azure infrastructure. It also uses Azure Active Directory to store and manage user identities, Azure BLOB, and Azure SQL to store metadata.
- With its very attractive pricing, Power BI has no competition. The desktop version of Power BI is free to use. The Pro version of Power BI cloud costs less than US$ 10 per month (cheapest in the market). The Premium version gives you enhanced data capacity at an attractive price.
- Beginners to Seasoned analytics professionals can use Power BI, that is designed as a self-service tool. Its drag-and-drop interface creates data-rich dashboards and engaging charts/graphs with built-in parallels to MS Excel. It also has a lot of educational information such as official guided learning and documentation.
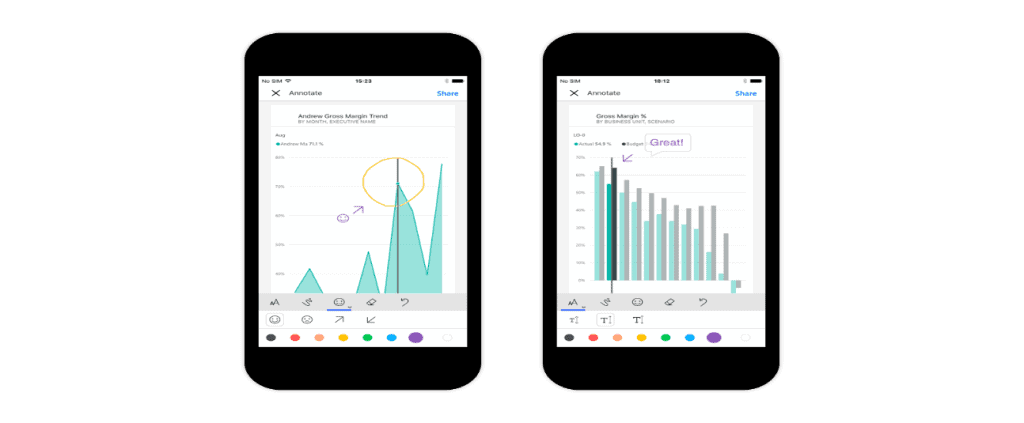
- It also has a mobile app, where you can access your data on the go. Power BI automatically populates your mobile app with your dashboards. The app comes with full enterprise mobility and security compatibility.
Data governance is the overall strategy that defines permissions to view, edit, and share data. Power BI supports data governance and security. A global admin can assign specific data sources and data sets, who can then control access permissions.
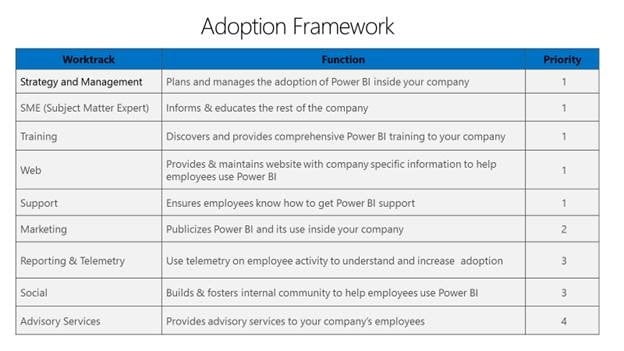
Four key stages in Power BI adoption
- Awareness stage – Firstly, making employees aware that an effective BI solution like Power BI exists.
- Understanding stage – Making the employees understand the benefits of Power BI to the organization, time and cost savings, efficiency, etc.
- Enablement stage – Employees get to know how to use the product and its features through Power BI training.
- Adoption stage – Finally, using the product regularly for the company’s BI requirements and reaping its benefits.
Visual appeal
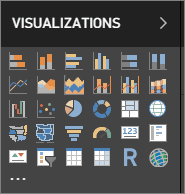
Power BI turns your data into gorgeous charts and graphs within a few minutes. In fact, it has an intuitive drag-and-drop menu filled with a library of custom visualizations. Additionally, visuals can be pinned from reports to dashboards in Power BI.
Users can download additional visuals from Microsoft. Some of the examples available in Power BI include:
- Basic and stacked area charts
- Bar and column charts
- Doughnut charts
- Funnel charts
- Line charts
- KPI indicators
- Tables
- Treemaps
- Waterfall charts

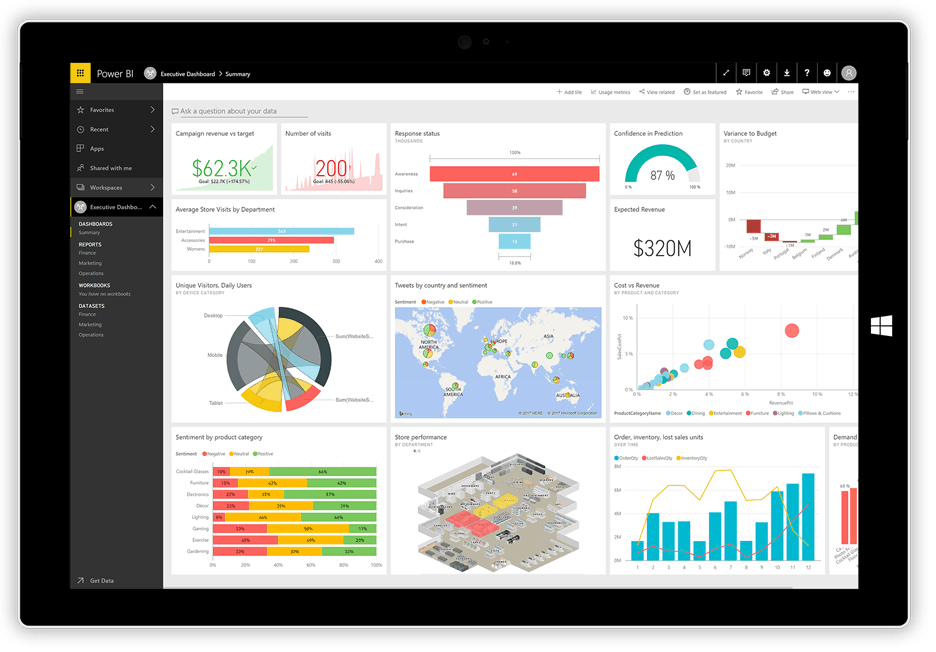
After transforming your data, you can pick the most useful charts and graphs. Furthermore, you can quickly combine them into a custom dashboard and share them with your team members.

When typing natural language queries with Power BI Q&A, you can specify the visualization type in your query. For example: “sales by state as a treemap”
Power BI has awesome features. Its intelligence platform includes Analysis and Integration Services, Master Data Services, Reporting Services, and several client applications for working with analytical data.
How ScaleupAlly can help you?
Our team at ScaleupAlly can strategically plan, discuss, and develop visually stunning data-driven dashboards. As Power BI consultants, we are skilled at using Power Query and DAX language. These help to query data sources, sort, upload, and analyze data and build reports with rich visuals. We offer the following services:
- Planning and configuring Power BI
- Integrating data sources with Power BI
- Preparing data to load into Power BI
- Creating measurables and columns for smaller datasets
- Developing role-based customized dashboards
- Training and post-implementation support

Dashboards created by us using Power BI
- Stunning and visually rich
- Have high levels of security and governance
- Seamlessly integrate with applications
- Can support advanced data analysis and
- Require no technical knowledge to use
Finally, all this comes at a fraction of the cost you will currently be spending on other BI tools.
For more insights, drop us an email here.
Related Blogs

Enterprise Business Intelligence: Key Benefits and Implementation Strategies
Learn how Enterprise Business Intelligence can improve decision-making and performance in organizations. Explore its benefits and effective implementation strategies.
Tarsem Singh
Apr 29 ,
16 min read

Power BI Report Builder: A Beginners Guide
Discover how to use Power BI Report Builder with this step-by-step guide. Learn installation, dataset connections, report design, and how to publish professional paginated reports.
Tarsem Singh
Apr 29 ,
9 min read

16 Practical Business Intelligence Examples
Explore 14 real-world examples of business intelligence. Learn how BI can improve your bottom line and customer satisfaction.
Tarsem Singh
Apr 29 ,
15 min read


