

Vizible
Illuminating Digital Success: A Power BI Case Study for Vizible
Sector
Digital Marketing
Services
Power BI Reports
Team Size
4
Engagement
Starting up & Scaling up

Introduction
Vizible is a UK-based digital marketing agency that has been instrumental in guiding companies towards growth in the digital realm. While they excelled in implementing various digital marketing strategies for their clients, they recognized the need to gain deeper insights into the outcomes of these strategies. To achieve this, they embarked on a Business Intelligence (BI) project, integrating Power BI with various social media platforms such as Facebook, Instagram, and Google, to make data-driven decisions and optimize their digital marketing efforts.
Business Objective
The project scope encompassed several critical components to achieve the desired business objectives:
- Data Collection: The project initiated with the gathering of data from various digital marketing platforms. Vizible collected data from Facebook Ads, Google Analytics, and Google Adwords, among others.
- Integration: The integration of this diverse data was a pivotal step in the project. It aimed to bring together data from disparate sources into a unified system for seamless analysis and reporting.
- Reporting: Vizible embarked on developing customized Digital Marketing Reports. These reports were designed to present actionable insights derived from data analysis.
- Insights Generation: The project’s success hinged on the extraction of meaningful insights from the integrated data. Vizible intended to leverage these insights for optimizing their marketing strategies and aligning their actions with client goals.
Project Scope
- Data Collection: The project initiated with the gathering of data from various digital marketing platforms. Vizible collected data from Facebook Ads, Google Analytics, and Google Adwords, among others.
- Integration: The integration of this diverse data was a pivotal step in the project. It aimed to bring together data from disparate sources into a unified system for seamless analysis and reporting.
- Reporting: Vizible embarked on developing customized Digital Marketing Reports. These reports were designed to present actionable insights derived from data analysis.
- Insights Generation: The project’s success hinged on the extraction of meaningful insights from the integrated data. Vizible intended to leverage these insights for optimizing their marketing strategies and aligning their actions with client goals.
Data Collection and Integration
Data collection involved aggregating data from multiple sources, each with its own format and structure. Vizible pulled data from Facebook Ads, Google Analytics, Google Adwords, and other platforms. This diverse dataset was then integrated into a single system, facilitated by Power BI. The integration process ensured that data flowed seamlessly and cohesively, providing a holistic view of digital marketing performance.
Key Performance Indicators (KPIs)
- The success of the project was measured through a range of Key Performance Indicators (KPIs). These KPIs provided a comprehensive view of the performance and effectiveness of Vizible’s digital marketing efforts. The KPIs included, but were not limited to:
- Pay-Per-Clicks (PPC): Tracking the number of clicks on ads, indicating user engagement.
- Visitor Statistics: Measuring the number of visitors to ads, assessing campaign reach.
- Conversion Rates: Evaluating the rate at which visitors took desired actions, such as making a purchase.
- Return on Investment (ROI): Calculating the profitability of marketing campaigns, reflecting the efficiency of ad spend.
- Cost Per Click (CPC): Analyzing the cost efficiency of ad clicks, helping to optimize ad budgets.
- Social Media Engagement: Measuring engagement metrics like likes, shares, comments, and follower growth on social media platforms.
BI Tools and Technologies
- Power BI: Power BI served as the central tool for data visualization, analysis, and reporting. It was instrumental in enabling Vizible to derive actionable insights from the integrated data.
- Dot Net: Dot Net technology played a significant role in ensuring data integration and system connectivity, helping to streamline the data collection process.
Data Analysis and Insights
- The project culminated in the development of three key dashboards, each dedicated to a specific aspect of digital marketing performance:
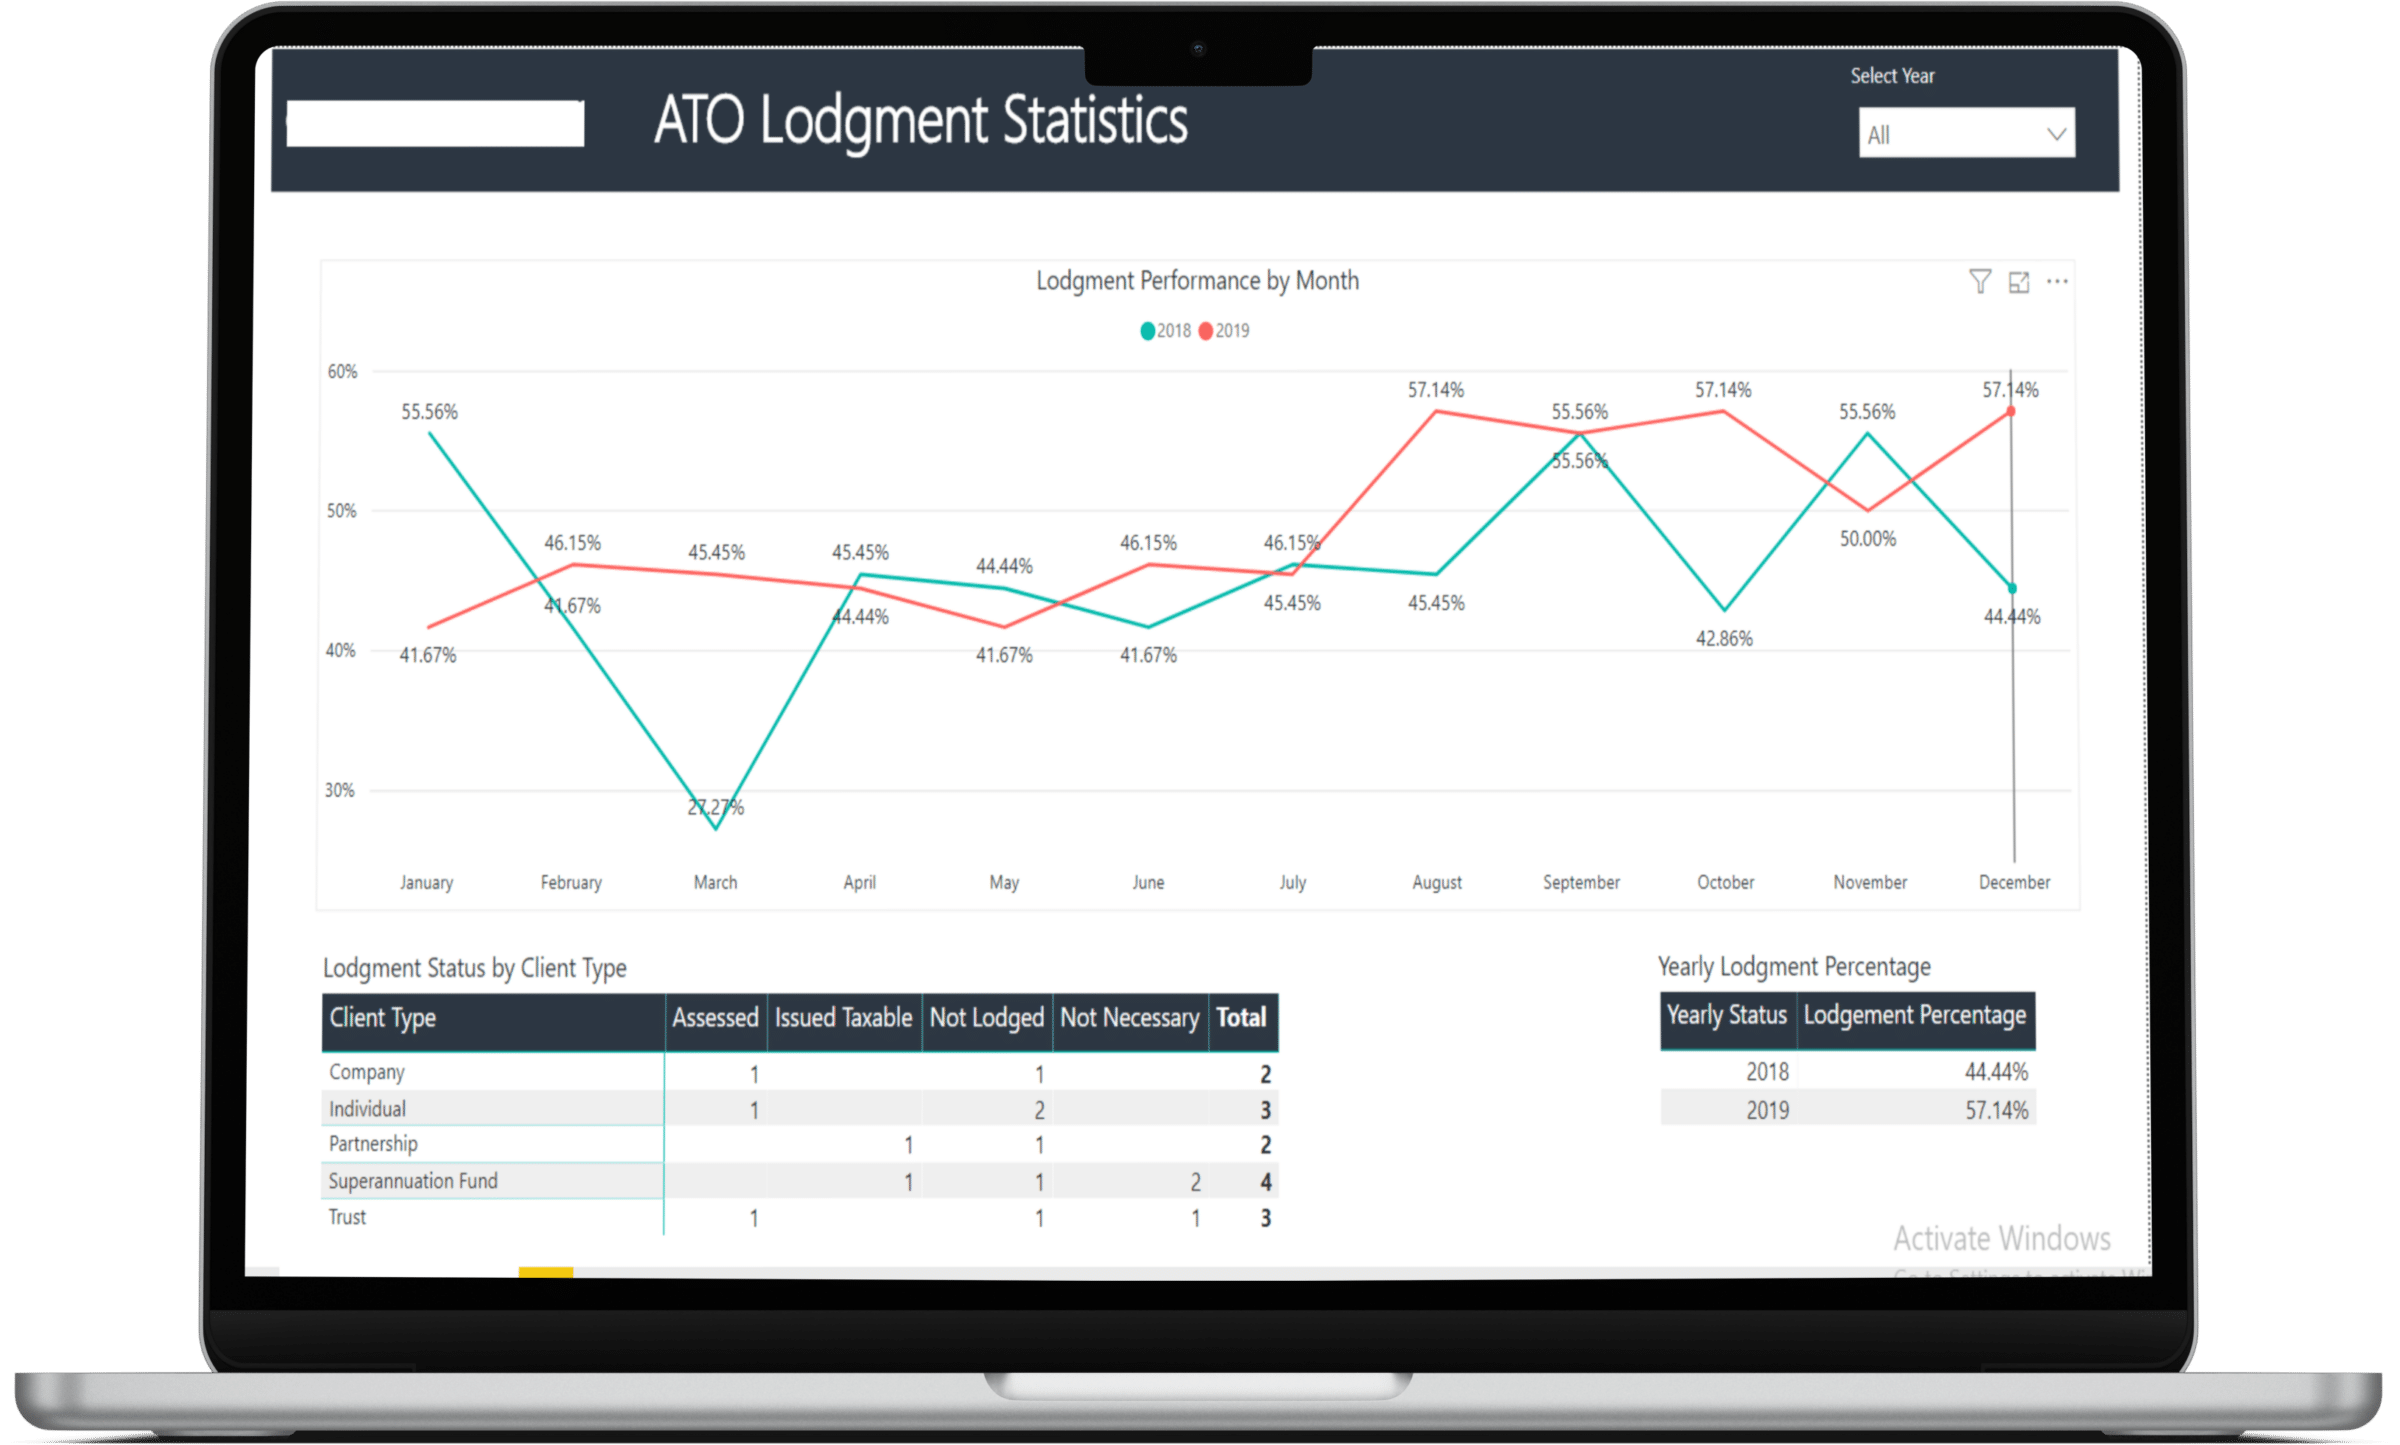
- Digital Marketing Performance Dashboard: This comprehensive dashboard offered insights into the performance of digital marketing campaigns. It included KPIs such as PPC, visitor statistics, conversion rates, and ROI. It allowed Vizible to assess the effectiveness of their campaigns and make data-driven optimizations.
- Social Media Engagement Dashboard: Focused on social media platforms, this dashboard tracked key engagement metrics. It provided real-time data on likes, shares, comments, and follower growth. This allowed Vizible to gauge the impact of their social media efforts.
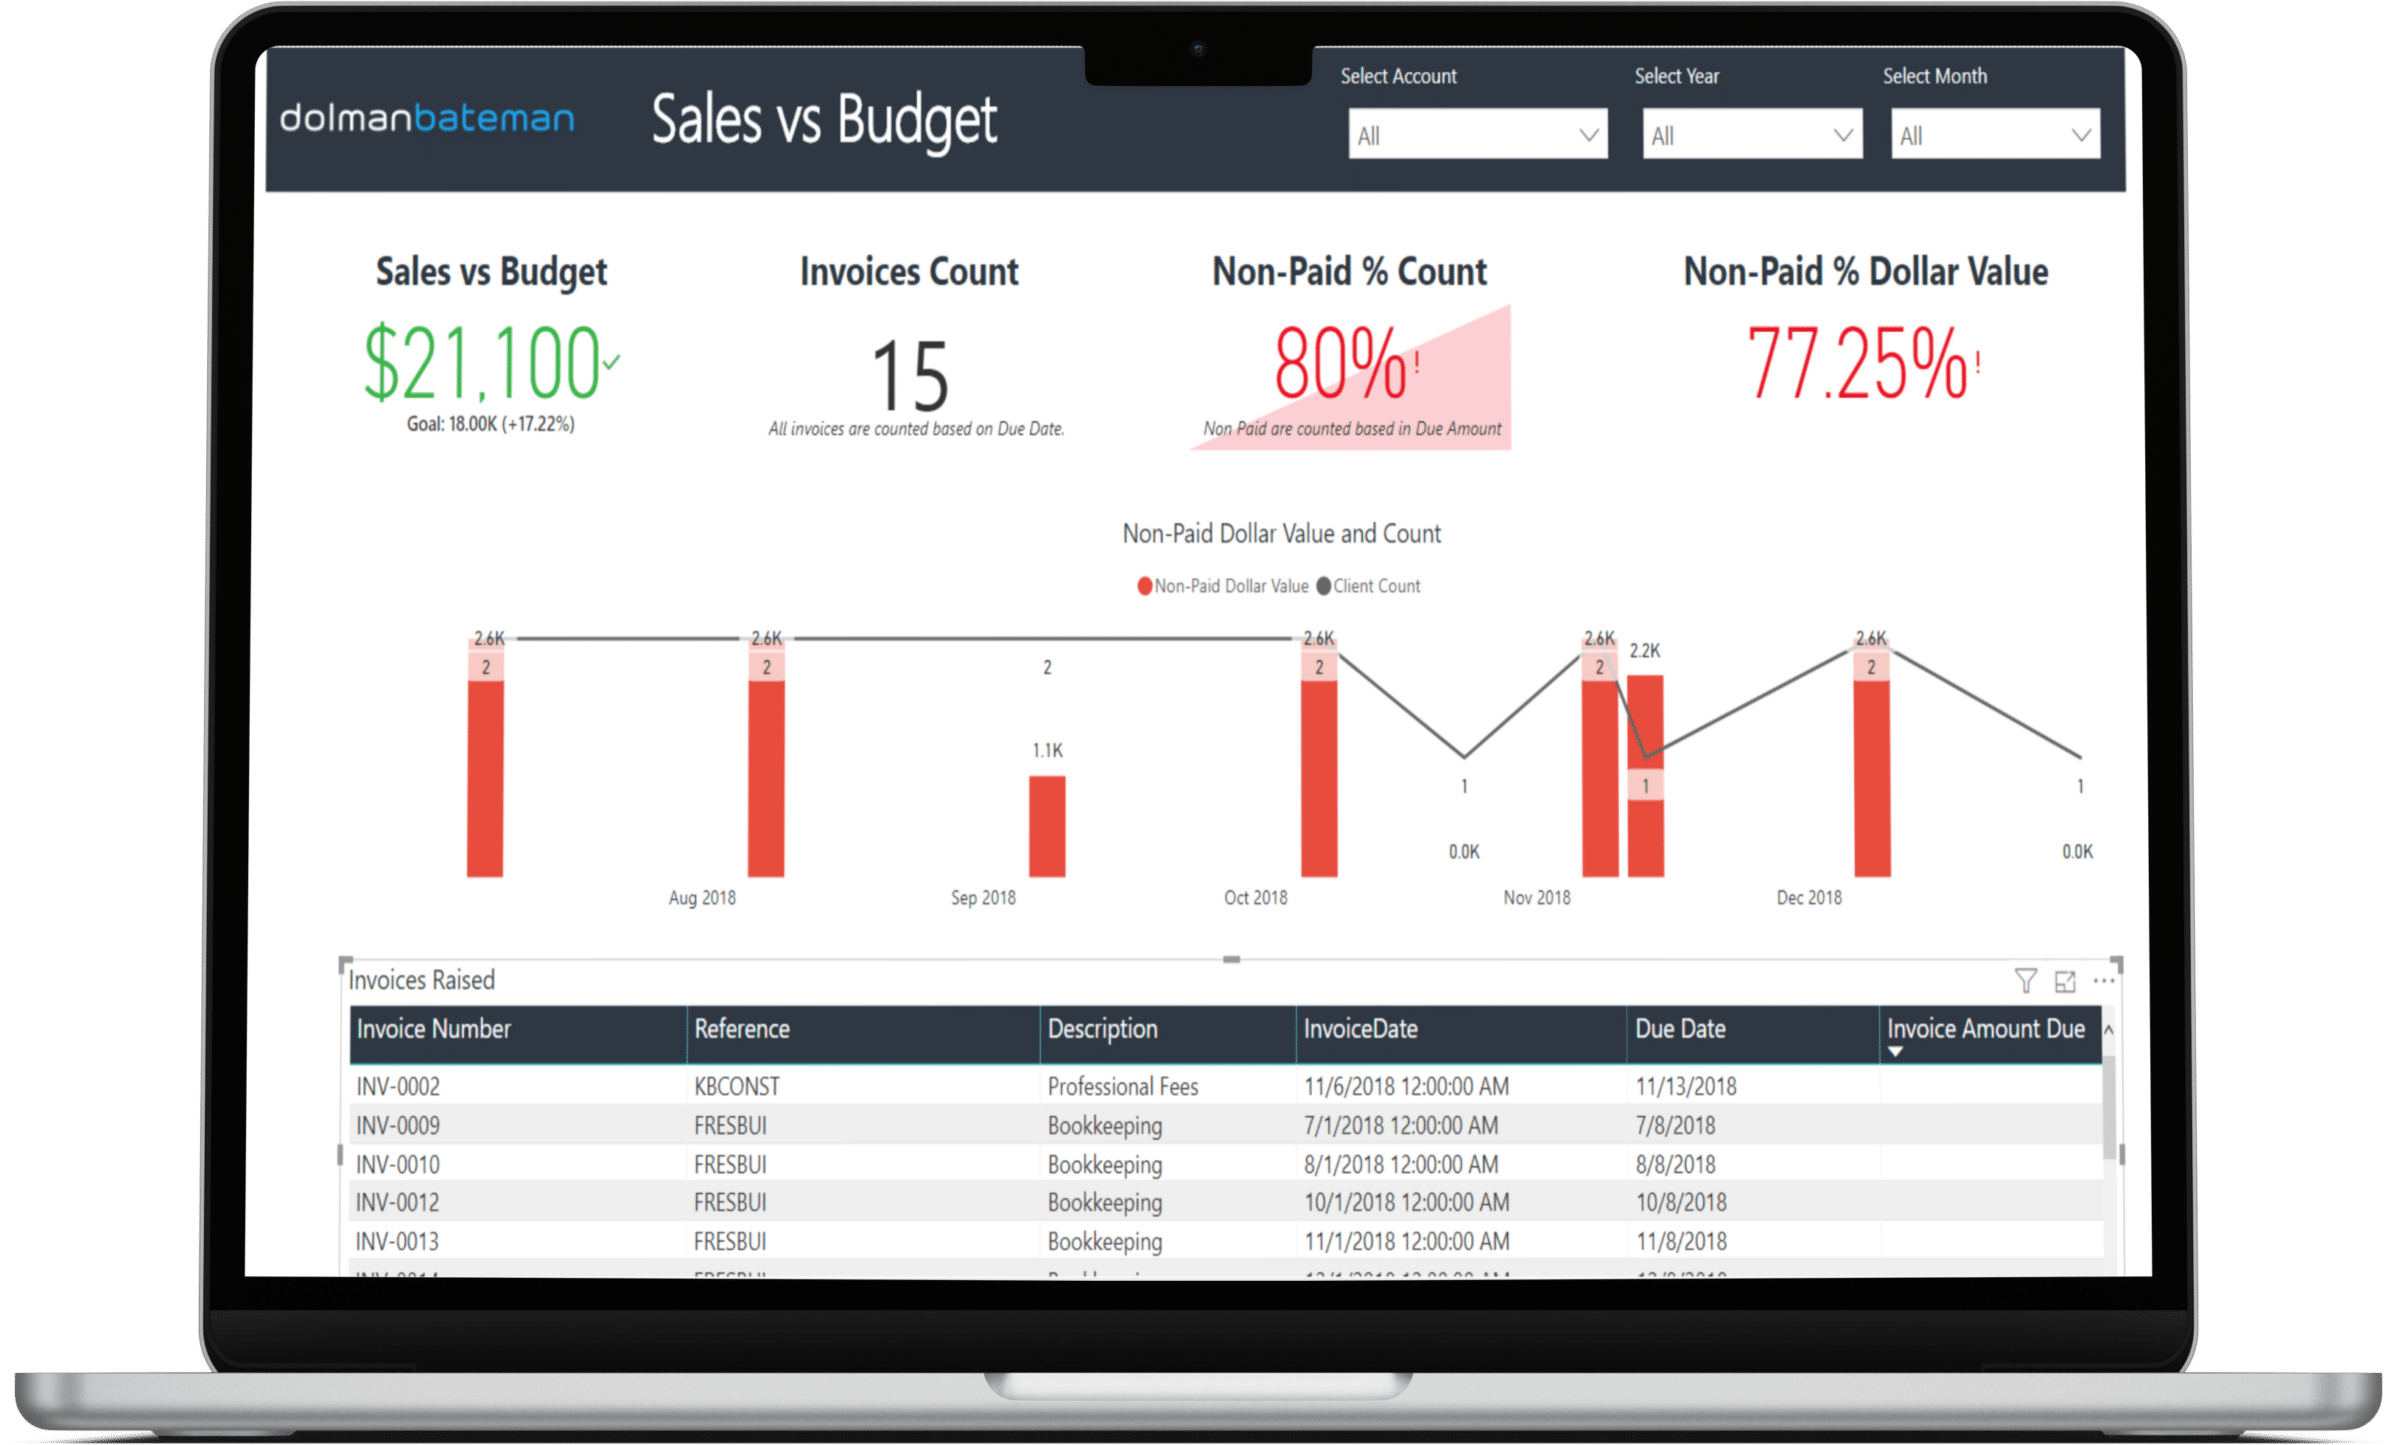
- Cost Efficiency Dashboard: This dashboard concentrated on the cost-effectiveness of digital marketing campaigns. It analyzed metrics such as CPC and ROI, offering insights into how efficiently ad budgets were utilized.
Challenges and Solutions:
- Challenges:
- Diverse Data Sources: Data was collected from multiple social media platforms, each with unique data structures and formats.
- Lack of Comprehensive Insights: Vizible recognized the need for in-depth insights into the performance of their digital marketing campaigns.
Solutions:
- Integration with Power BI: To address the challenge of diverse data sources, Vizible leveraged Power BI to unify data and ensure seamless integration.
- Customized Reporting: Vizible developed customized Digital Marketing Reports to provide the specific insights they required. These reports offered in-depth analyses of KPIs, empowering data-driven decision-making.
Conclusion
By integrating Power BI with various social media platforms, Vizible successfully enhanced its ability to generate meaningful insights related to digital marketing performance. This transformation allowed Vizible to make informed decisions, optimize marketing strategies, and ensure that marketing actions were outcome-focused. The customized reports, including metrics like PPC and visitor statistics, have empowered Vizible to continue guiding companies toward successful digital marketing
What our customers say
Scaleupally has been an indispensable partner for our operations. Their BI solutions have not only improved our internal processes but have also helped us better understand our customers’ needs. The data-driven approach they bring to the table has given us a competitive edge in our industry. We look forward to a long and fruitful partnership.