

Soha Living
SoHa Living's Journey through Data-Driven Strategies
Sector
E-commerce
Services
Power BI Reports
Team Size
4
Engagement
Starting up & Scaling up

Introduction
Founded by two visionary sisters, Brooke Watson & Shyrah Maurer, SoHa Living began its journey in 2002, inspired by their travels to bring unique home and gift items to Hawai’i. Embracing the lifestyle of leisure, coastal chic, and tropical luxury, SoHa Living offers a haven where customers discover new and memorable products, preserving cherished memories and good times.
Business Objective
Business Use Cases:
- Customer Segmentation and Personalization: SoHa Living can use data analysis to segment their customer base into distinct groups based on shopping behavior, preferences, and demographics. By doing this, they can personalize marketing efforts, product recommendations, and promotions for each segment. For example, they can create special offers for loyal customers or those who prefer certain product categories.
- Inventory Optimization: SoHa Living can employ data-driven inventory management to optimize stock levels at different store locations. They can use historical sales data, seasonality trends, and vendor performance metrics to make informed decisions about inventory replenishment, reducing overstock and stockouts. This ensures that each store has the right products at the right time.
- Store Performance Benchmarking: To improve store performance, SoHa Living can compare the performance of each store by analyzing metrics such as foot traffic, sales per square foot, and customer satisfaction scores. They can identify top-performing stores and share best practices across the organization, helping underperforming stores improve their metrics.
- Vendor Relationship Management: SoHa Living can evaluate vendor performance based on data insights. This includes tracking metrics like on-time delivery, product quality, and sales contribution. By identifying high-performing and underperforming vendors, they can negotiate better terms, diversify their product offerings, and ensure a consistent supply of popular products.
Project Scope
The BI project encompassed the following aspects:
-
- Extracting data from diverse sources (LightSpeed POS, Xero, SQL, Spreadsheets).
- Building a centralized database using AWS.
- Developing Power BI Dashboards for data visualization and analysis.
- Creating KPIs and store-level, brand-level, and SKU-level dashboards.
- Implementing Row-level Security to grant access to specific store managers.
- Embedding reports on the website for easy access.
Data Collection and Integration
Data was collected from various sources, including LightSpeed POS, Xero, SQL, QuickBooks, and Excel. All the data was consolidated into a centralized database hosted on AWS.
Key Performance Indicators (KPIs)
- Total Sales
- Total Profit
- Gross Margin
- Average Ticket Value
- Average UTP (Units per Transaction)
- Total Purchase Orders Released
- Total Purchase Orders Received
- SKU Sales by Store
- Sales by Category and Subcategory
- Sales by Vendor
BI Tools and Technologies
- Power BI: Data visualization tool for interactive dashboards.
- LightSpeed POS: Point of Sale system for store transactional data.
- AWS S3: Cloud-based storage for data consolidation.
- QuickBooks: Accounting tool for financial data.
- Microsoft Excel: Used for data processing.
- MySQL: Utilized for querying and data manipulation.
- Python: Implemented for data extraction and API-related tasks.
Data Analysis and Insights
- The Power BI dashboards provided valuable insights, including:
- Sales Performance Dashboard: Highlights KPIs such as Total Sales, Total Profit, Gross Margin, Average Ticket Value, and Average UTP, along with detailed breakdowns.
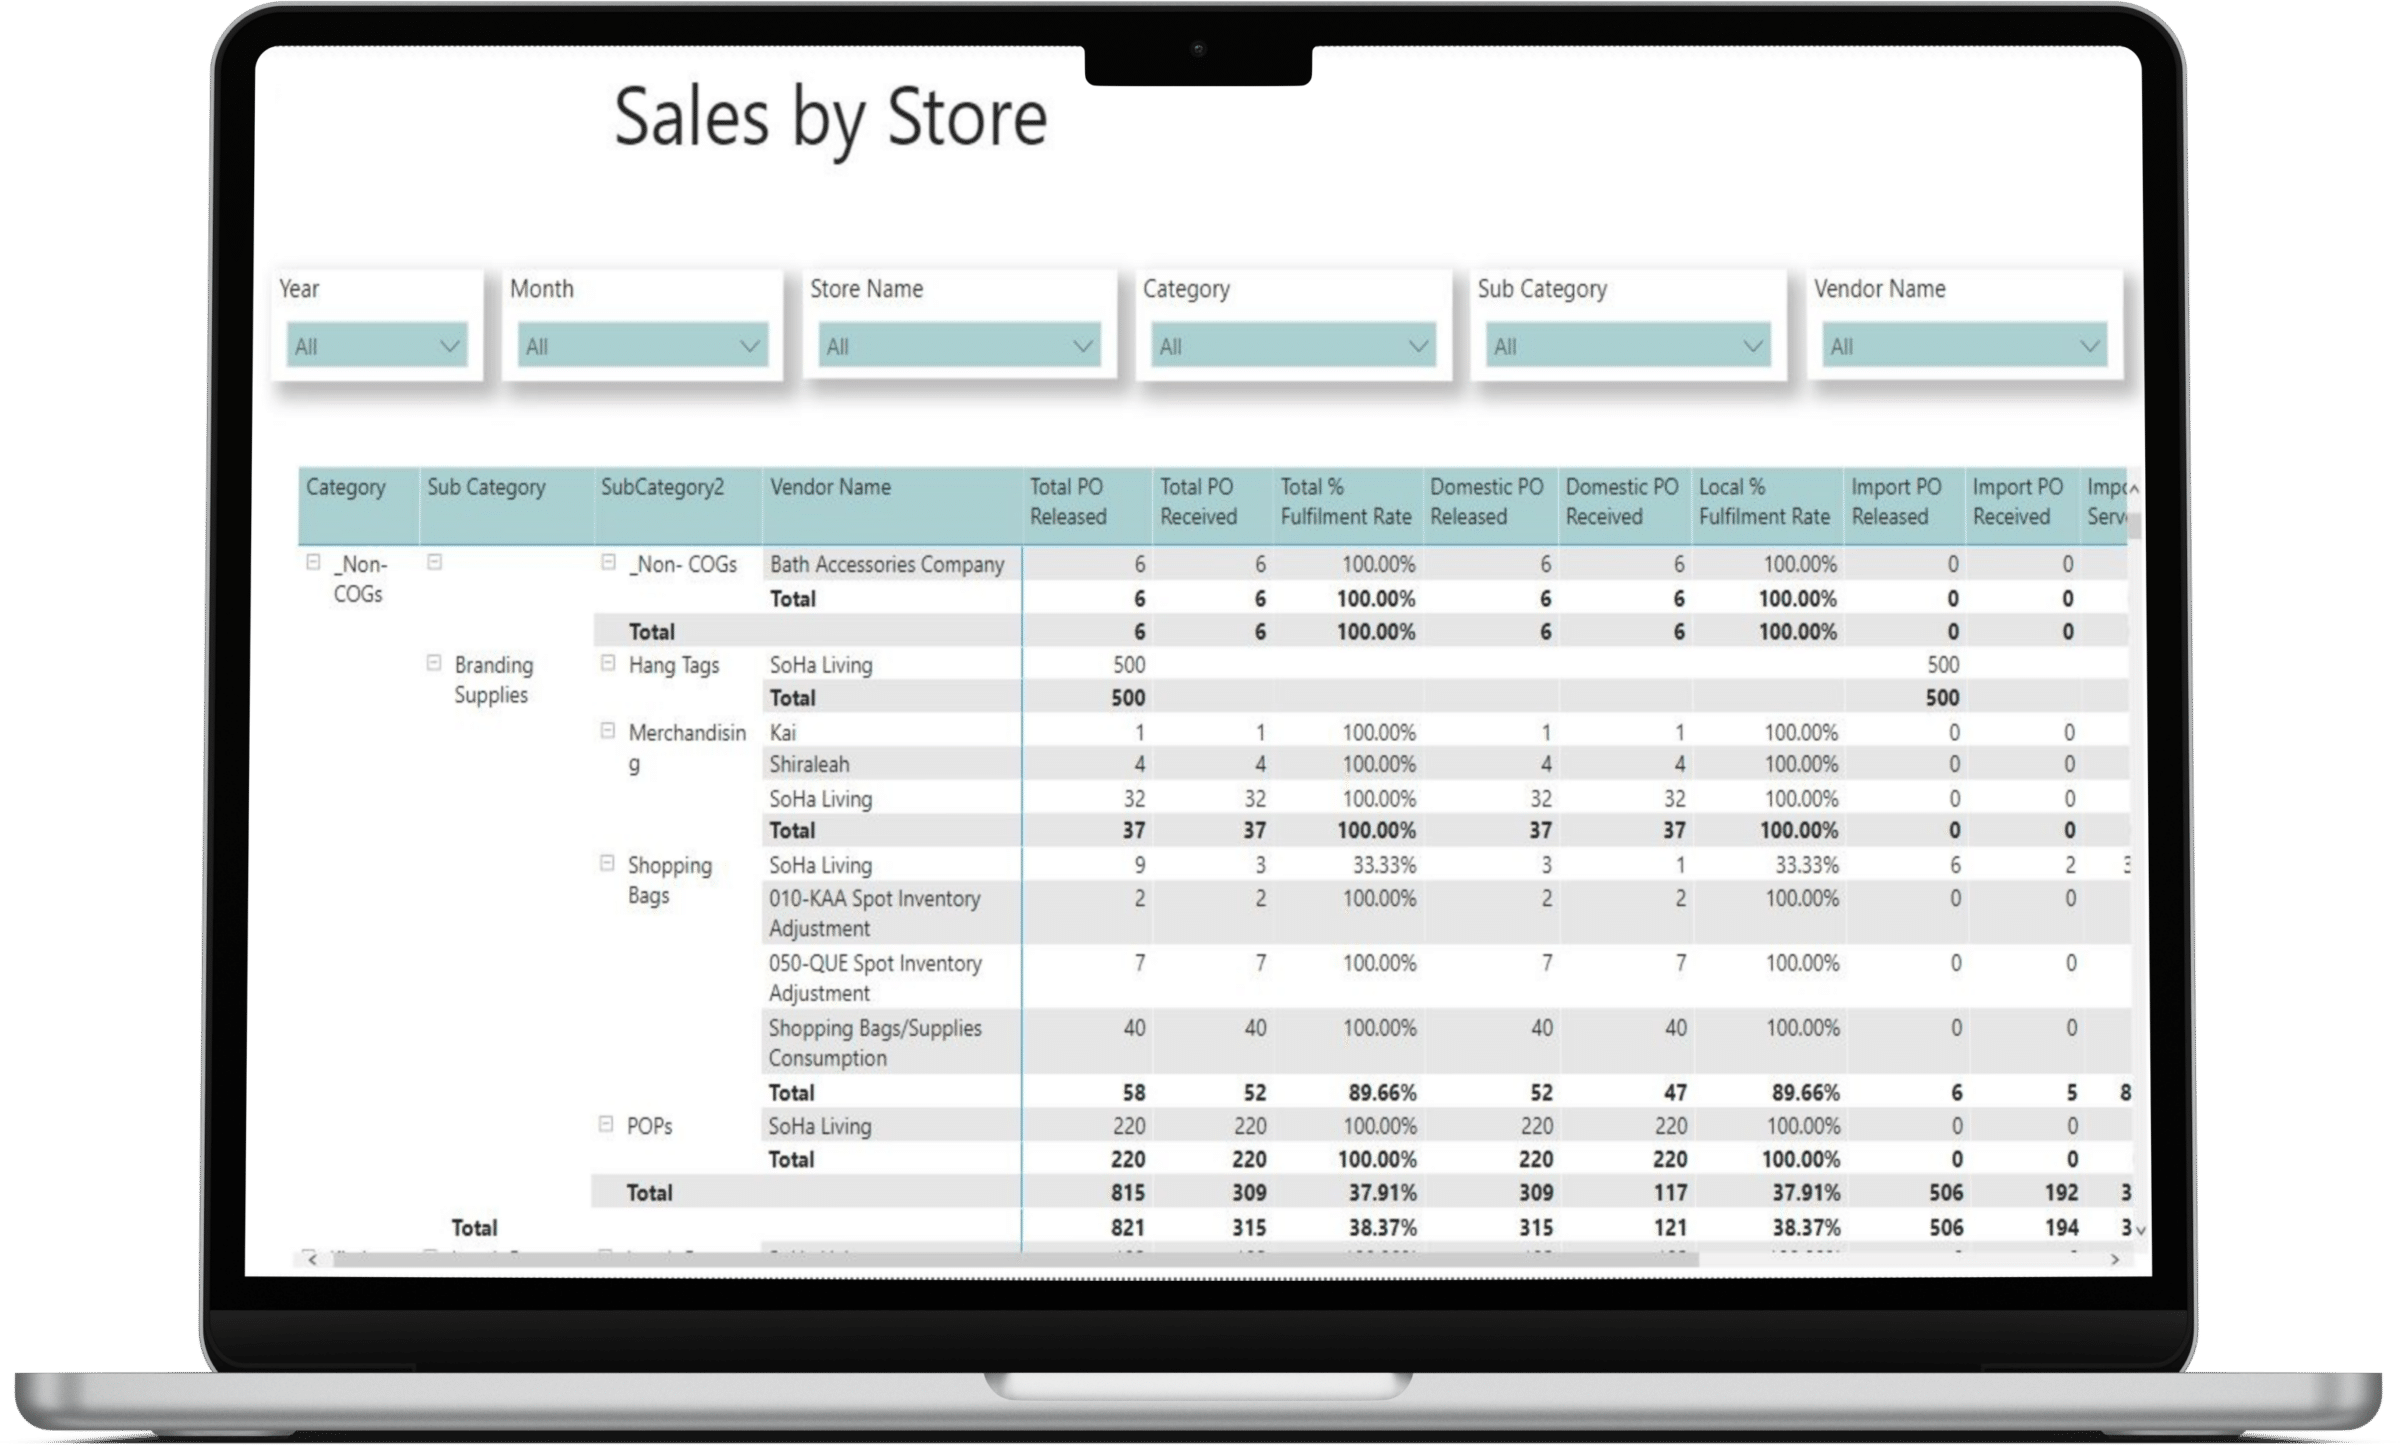
- Sales by Store Dashboard: Shows total sales by all stores, with filter options for year, month, store name, category, subcategory, and vendor name.
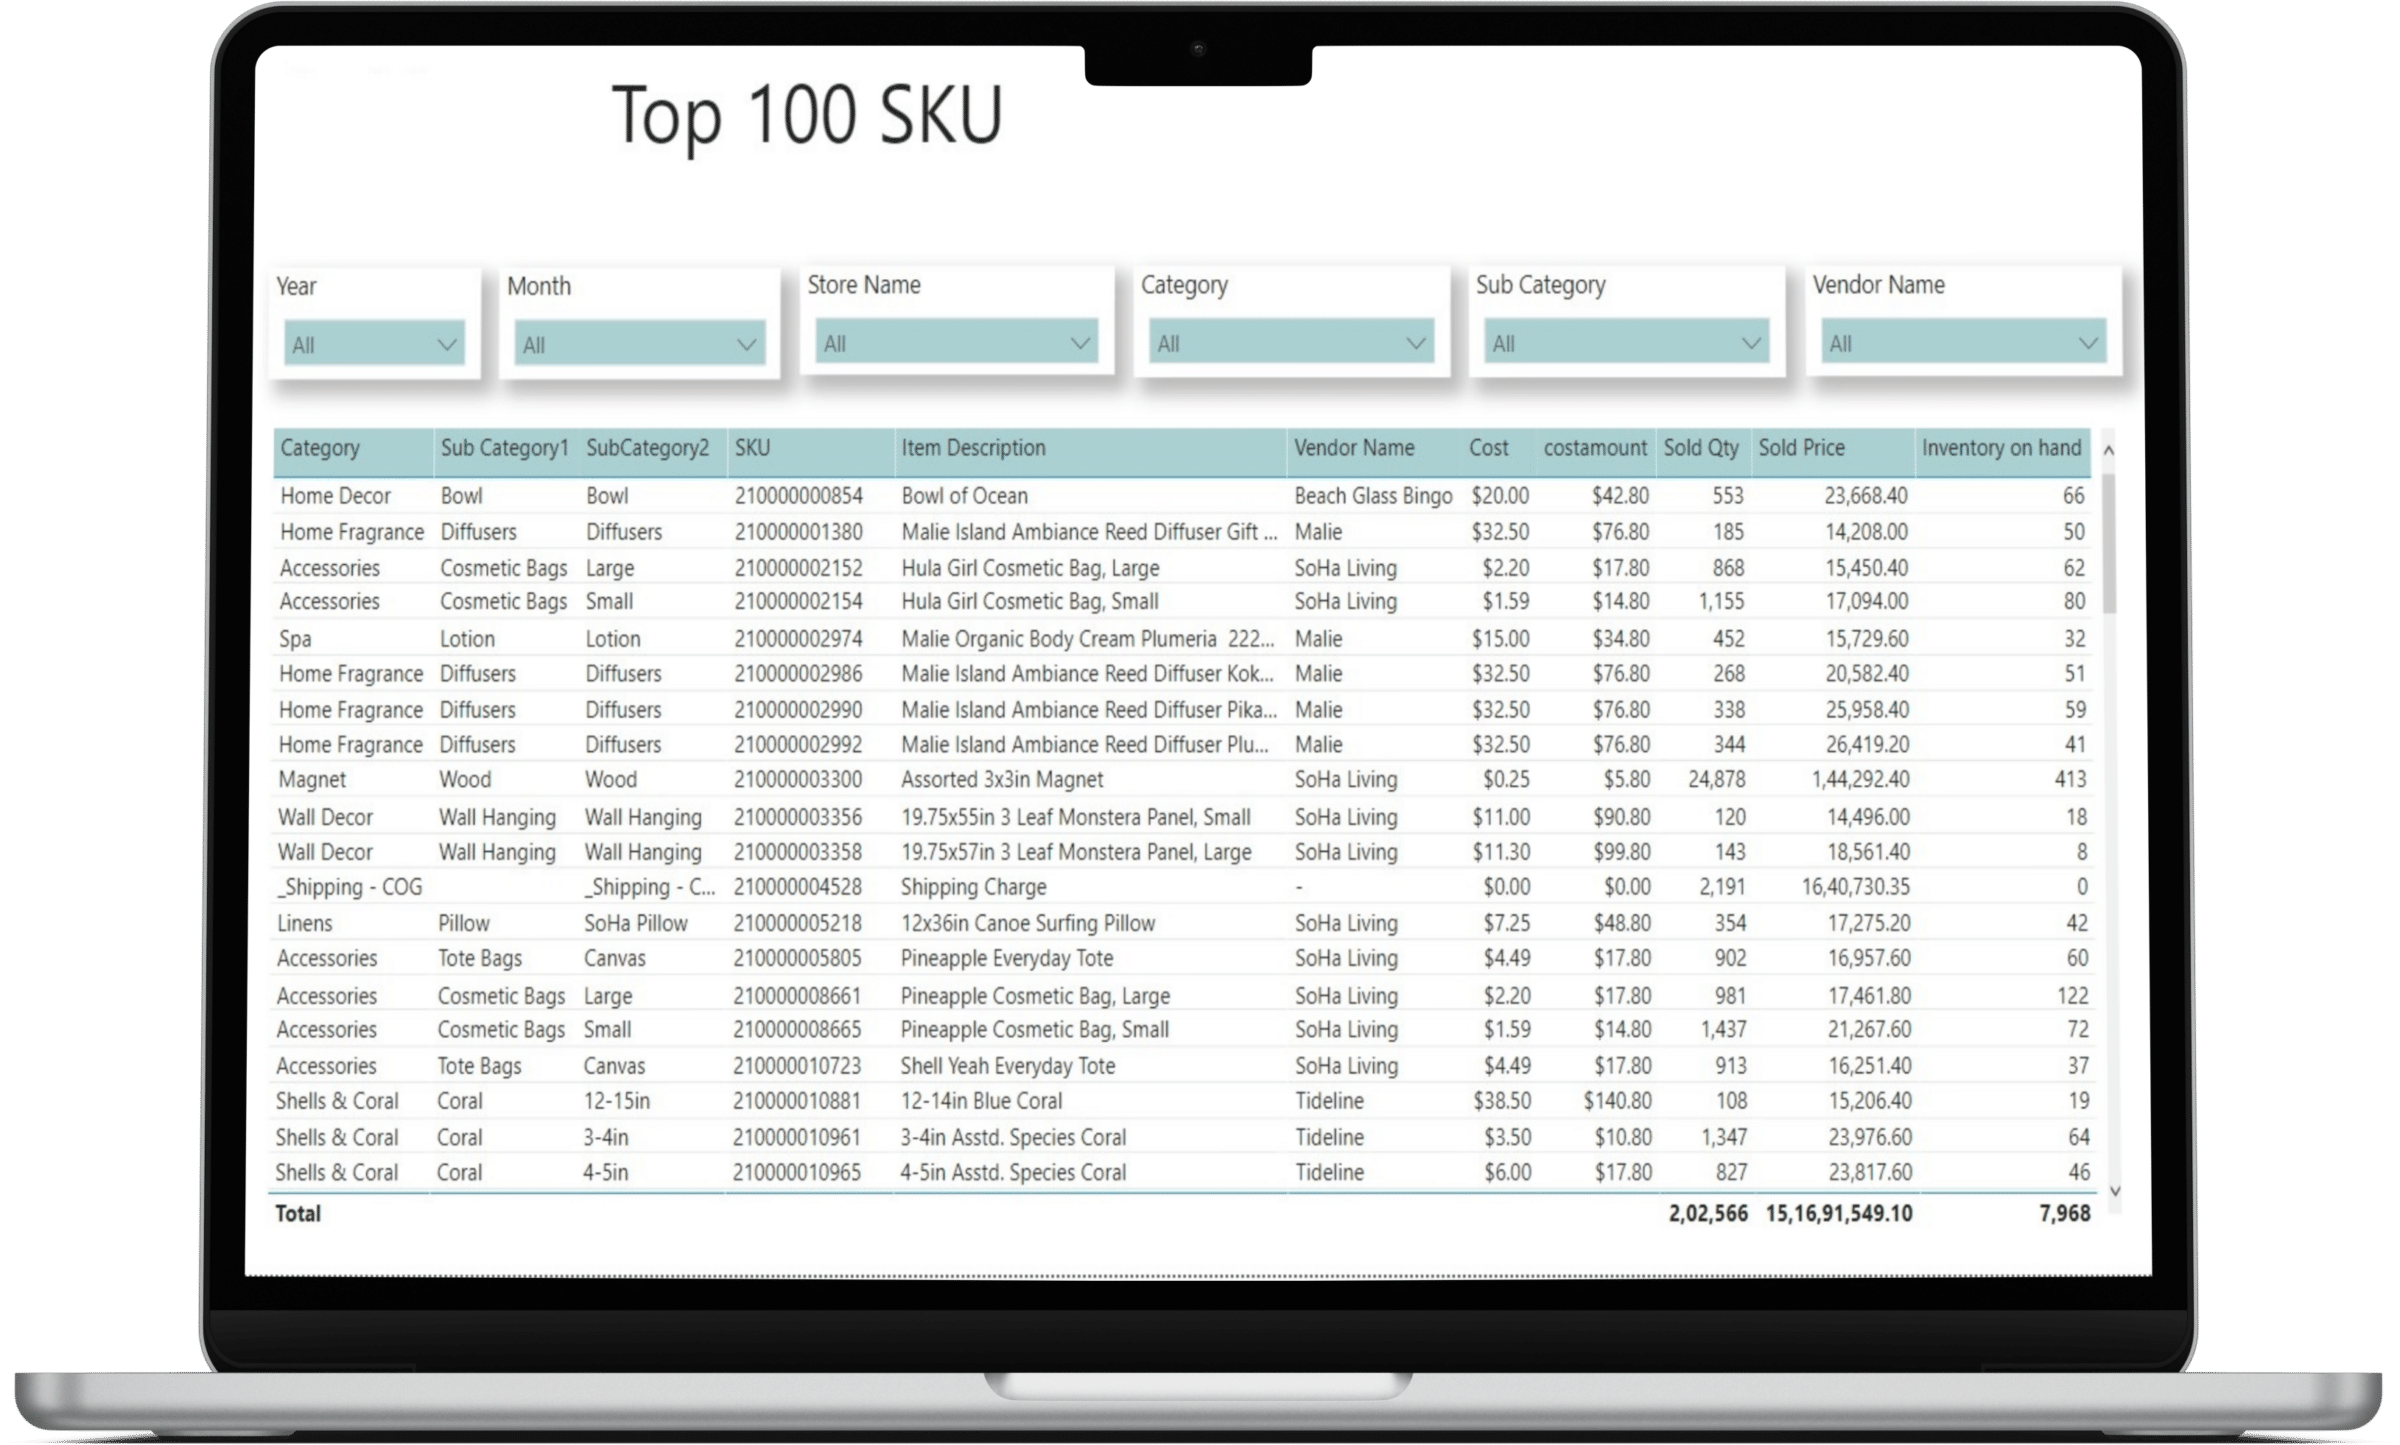
- Sales of Top 100 SKUs Dashboard: Displays sales of the top 100 SKUs, with filter options for year, month, store name, category, subcategory, and vendor name.
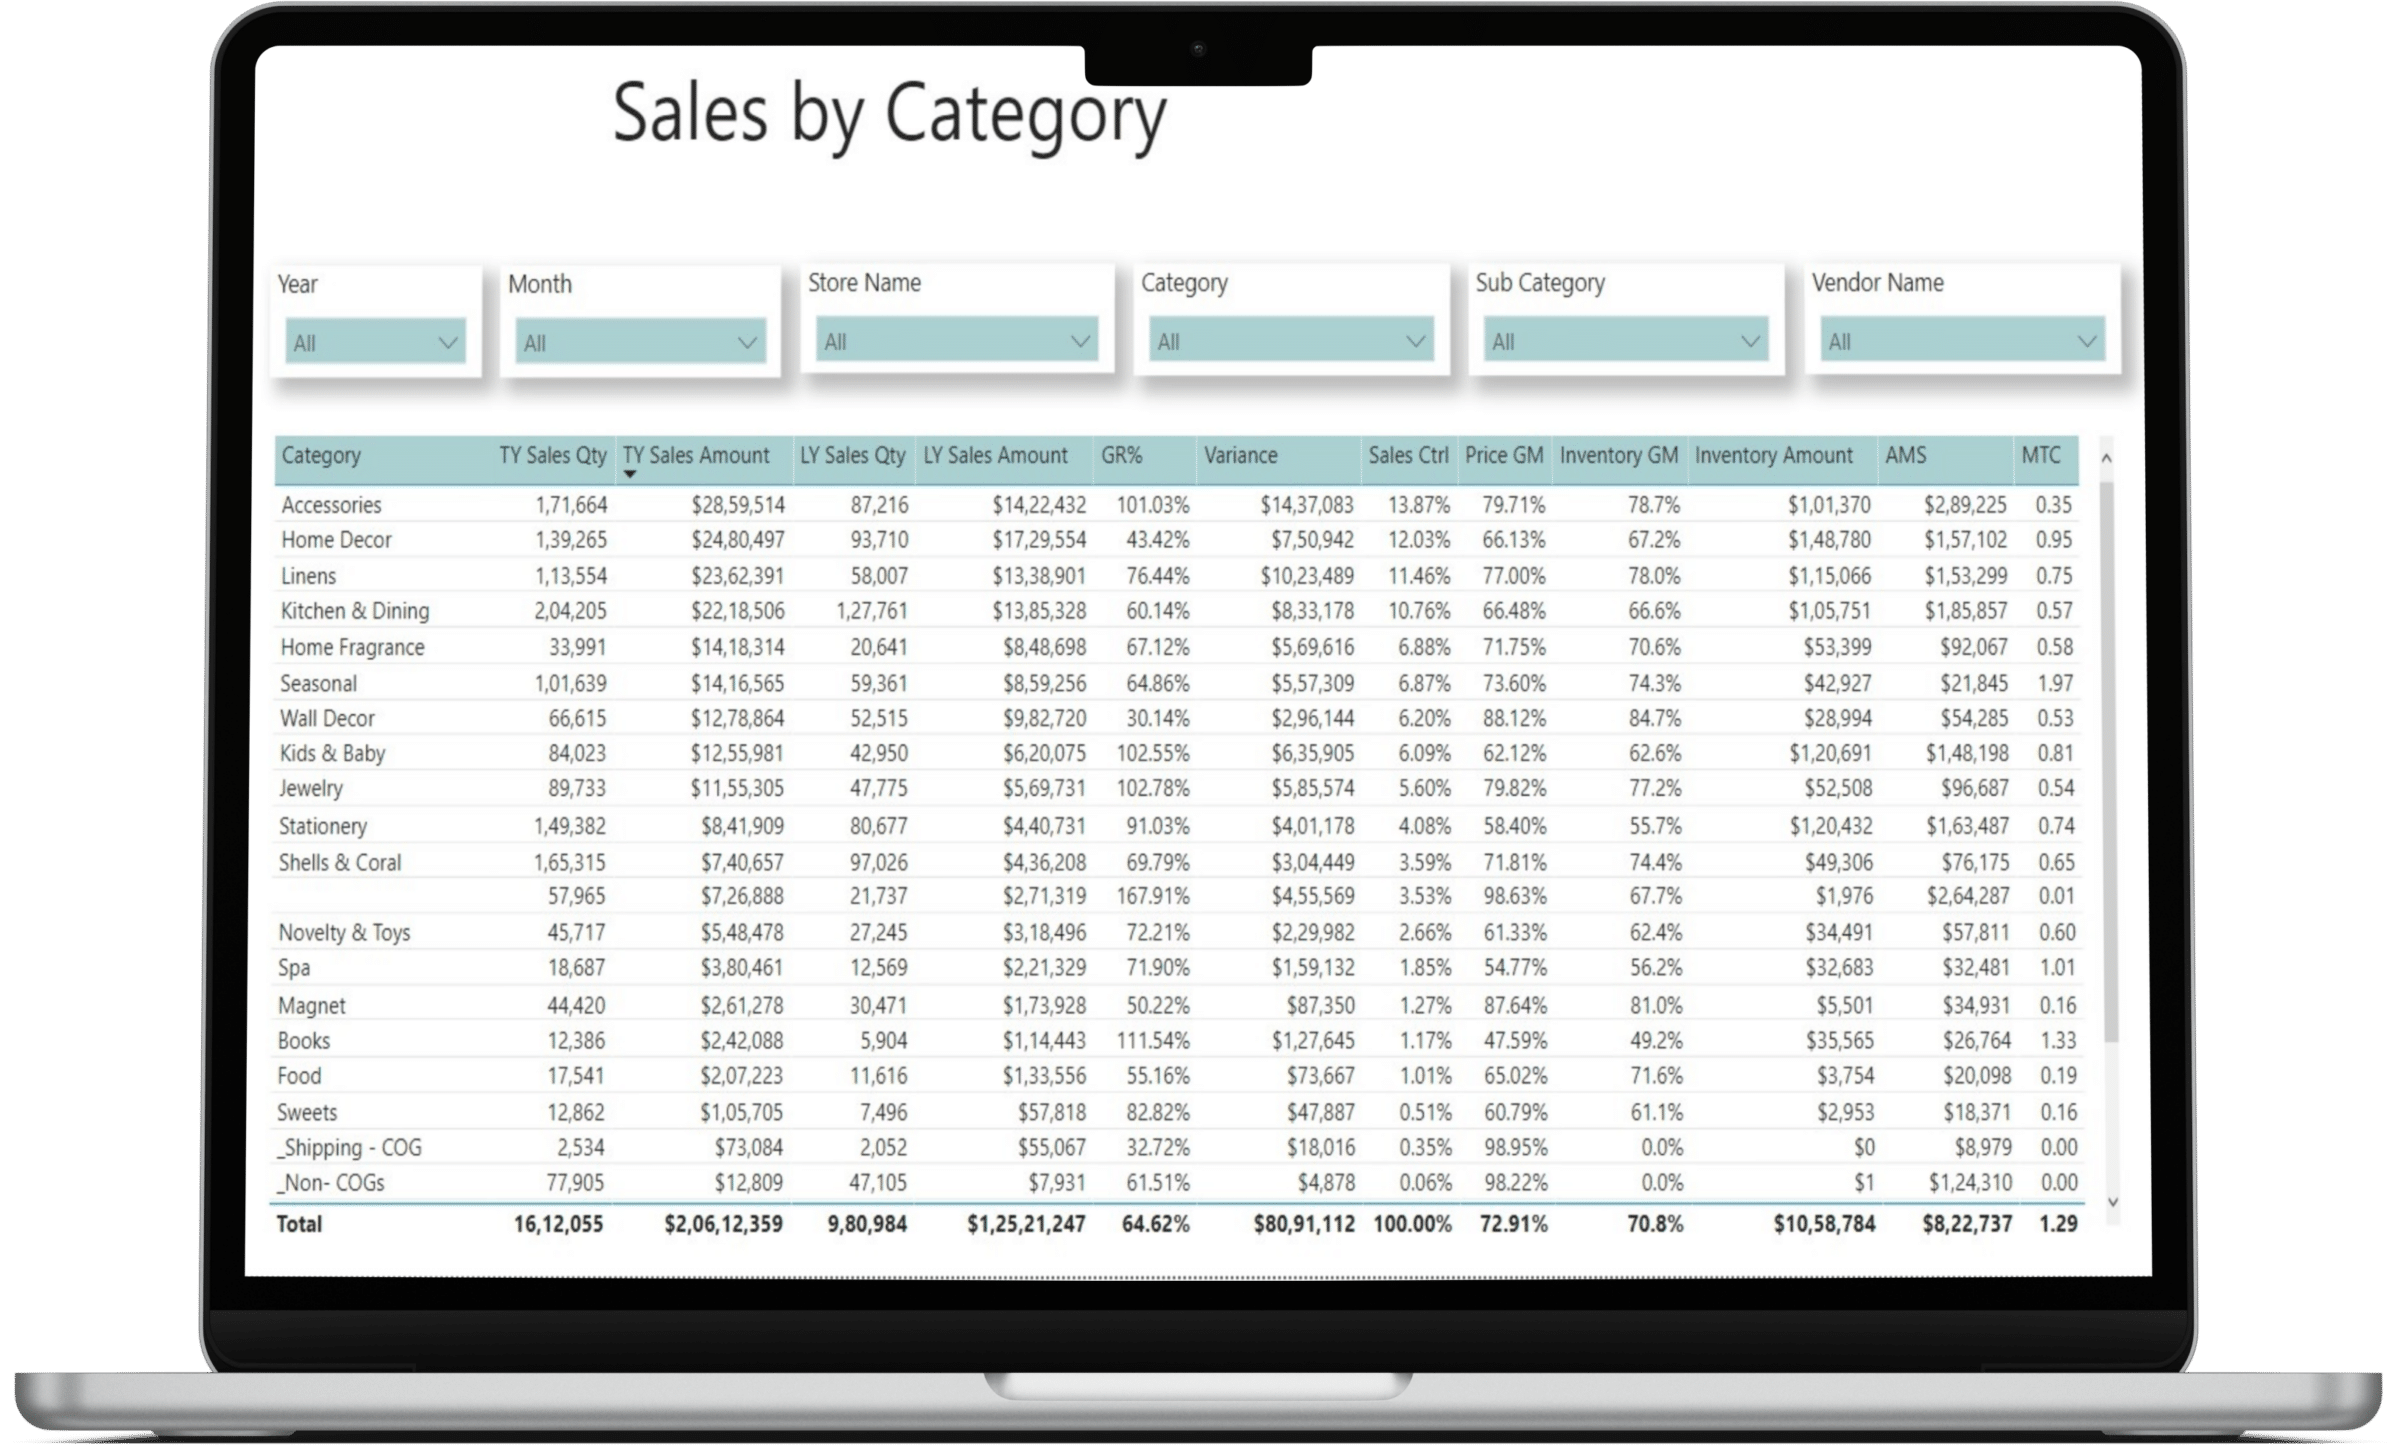
- Sales by Category Dashboard: Analyzes sales of products by category, subcategory, store name, and vendor name.
Challenges and Solutions:
- Challenges:
- Scattered data from multiple sources.
- Limited data insights due to conventional reporting methods.
- Complex store-wise reporting requirements.
- Large dataset refresh challenges.
Solutions:
- Consolidated data into a centralized database on AWS S3.
- Developed Power BI Dashboards for in-depth insights.
- Implemented Row-level Security for store-wise reporting access.
- Automated data refreshing using schedulers.
Conclusion
SoHa Living’s transformation journey with Business Intelligence has been nothing short of spectacular. By unifying their scattered data and harnessing Power BI’s capabilities, they gained valuable customer insights and improved decision-making. With store-specific reporting and embedded dashboards, SoHa Living empowered their managers to drive performance and engage customers effectively. The automated data refreshing ensured real-time analytics, enabling SoHa Living to uphold its promise of delivering a joyful shopping experience that captures precious memories and coastal chic allure.
What our customers say
I wholeheartedly commend ScaleUpAlly for their outstanding Business Intelligence service. Their expertise in data extraction, visualization, and security mirrors the successful journey of SoHa Living. ScaleUpAlly’s personalized solutions, user-friendly dashboards, and data automation have transformed our decision-making process. Their commitment to client satisfaction, much like SoHa Living’s experience, makes them an invaluable partner in our data-driven journey.