12 Different Types of Power BI Reports [Explained]
Tarsem Singh | July 23, 2024 , 18 min read
12 Different Types of Power BI Reports [Explained]
Tarsem Singh | July 23, 2024 , 18 min read
Table Of Content
Every organization needs to communicate data clearly. That’s where Power BI comes in. In this guide, we explore 12 Power BI report types—from Sales Analysis to Paginated—designed to meet diverse business needs, stakeholder roles, and decision-making requirements.
Use the right report type to transform raw data into business insights that inform strategies, drive growth, and foster collaboration.
Before we look at the different types of reports in Power BI let us first understand why it is important to create a good and efficient report in the first place.
Good reports show data clearly, helping you see trends and patterns to make beneficial decisions. Without them, you risk leading blindly, which can have detrimental effects on your company’s success.
Here are some compelling reasons why good Power BI reports are essential:
Customers are on the move and moving very fast. Your ability to make swift, smart decisions can determine their loyalty. It costs four to five times more to acquire new customers than to retain current ones.
A good Power BI report grants you access to customer data. This insight enables you to make decisions that will keep your customers loyal and place you ahead of your competitors, which can ultimately result in positioning your business as a leader in your industry.
Another benefit of a good power BI report is that it enables you to monitor your business’s performance continuously.
They answer critical questions such as:
A good Power BI report helps you track key performance indicators (KPIs). You can measure these KPIs against your business goals to identify the areas that need improvement.
To maximize these benefits, many companies rely on professional Power BI services to design reports and dashboards aligned with their business goals.
Acting when the ship has already been sailed, is a waste. Have access to real-time data with high-quality Power BI reports. Act on the newest data you have. Moving on real-time info makes sure you catch chances and don’t respond too late to market shifts. Time matters and good Power BI reports let you move quickly and smartly.
Also read: How to Optimize Power BI Report Performance?
Most of the report types listed below are interactive reports, created using Power BI Desktop and saved as .pbix files. These allow users to filter, sort, and drill down into the data for deeper exploration.
You can also import Excel workbooks (.xlsx) into Power BI to either use as a data source or convert them into basic reports. While not as powerful as .pbix-based visuals, Excel integration can be helpful for organizations transitioning from spreadsheet reporting.
Here’s a breakdown of the different reports you can create in Power BI:
| Report Type | Use Case | Tool Used | Audience |
|---|---|---|---|
| Sales Analysis | Track sales trends, performance | Power BI Desktop | Sales Managers |
| Financial Analysis | Revenue, profit, cash flow monitoring | Power BI Desktop | CFOs, Finance Teams |
| HR Analytics | Monitor hiring, attrition, skills | Power BI Desktop | HR Teams |
| Customer Profitability | Identify high-value customer segments | Power BI Desktop | Marketing, Finance Teams |
| Digital Marketing | Campaign performance tracking | Power BI Desktop | Digital Marketers |
| Website Analytics | Track web behavior & conversion paths | Power BI Desktop | Marketing Teams |
| Dashboards | At-a-glance metrics and KPIs | Power BI Service | Executives, Team Leads |
| KPI Dashboards | Goal tracking | Power BI Service | Executives |
| Variance Analysis | Budget vs actual comparisons | Power BI Desktop | Finance, Operations |
| Market Share Analysis | Competitive performance monitoring | Power BI Desktop | Strategy, C-Level Executives |
| Key Driver Analysis | Understand impact of variables on KPIs | Power BI Desktop | Analysts, Business Leaders |
| Paginated Reports | Invoices, legal docs, formatted output | Power BI Report Builder | Finance, HR, Compliance |
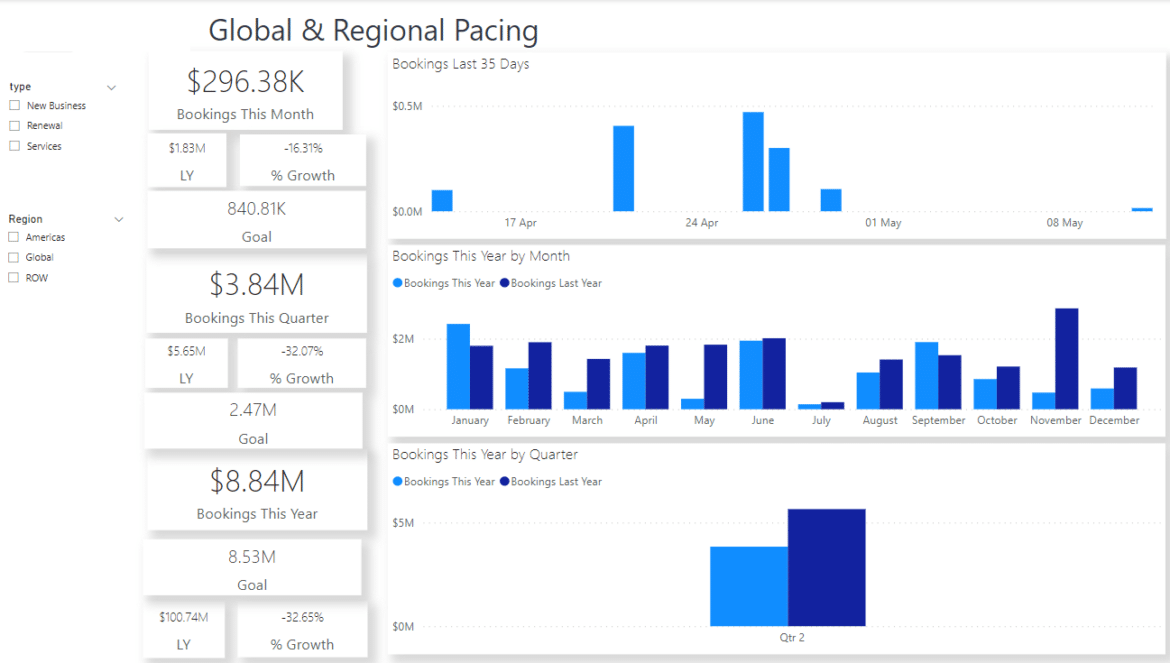
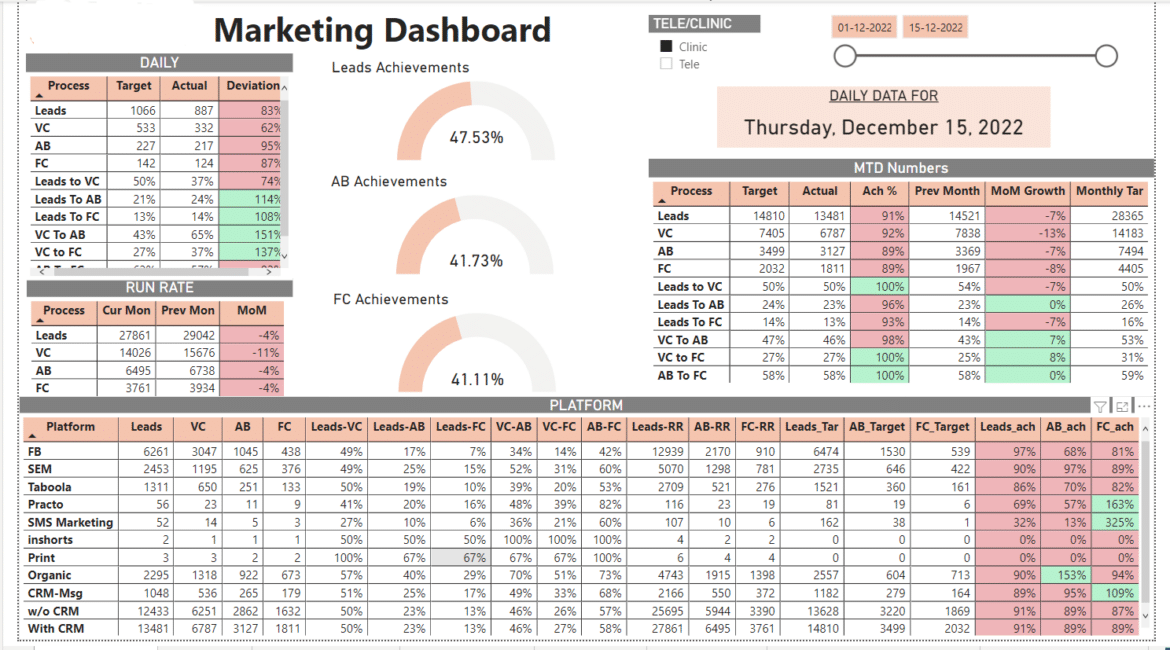
Just like the name suggests, sales analysis reports are designed to provide insights into a company’s sales performance. With a sales analysis report, you can track revenue, sales volume, and growth trends.
These reports help sales managers and teams know their standing in terms of targets, identify high-performing products or services, and recognize areas that need improvement.
Key features:
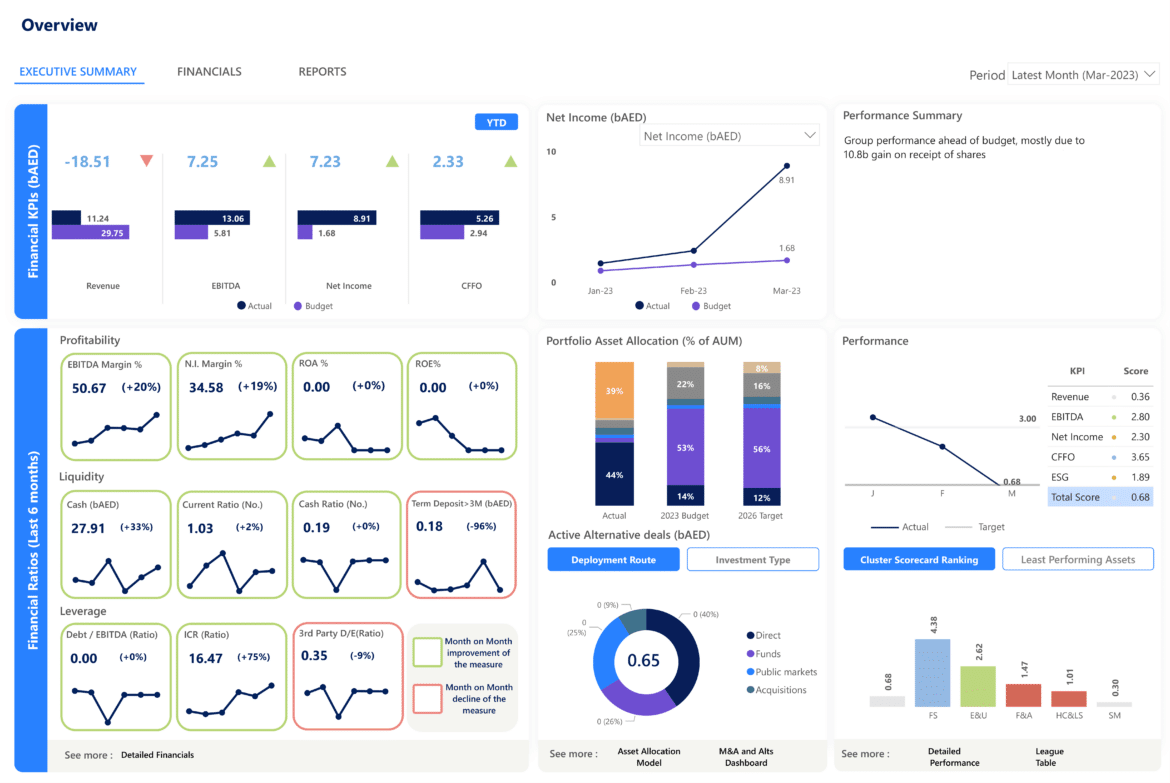
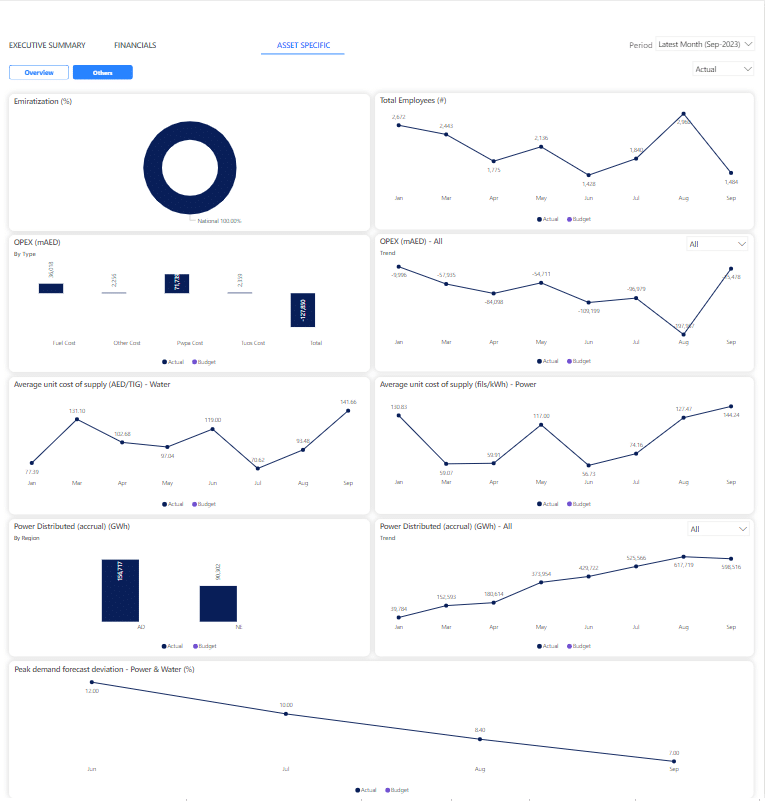
A financial analysis Power BI report gives an overview of a company’s finances. This usually includes income statements and cash flow statements. These reports are useful to CFOs and financial analysts.
This is because they help monitor the company’s financial performance and allow them to make strategic decisions backed by data.
Key features:
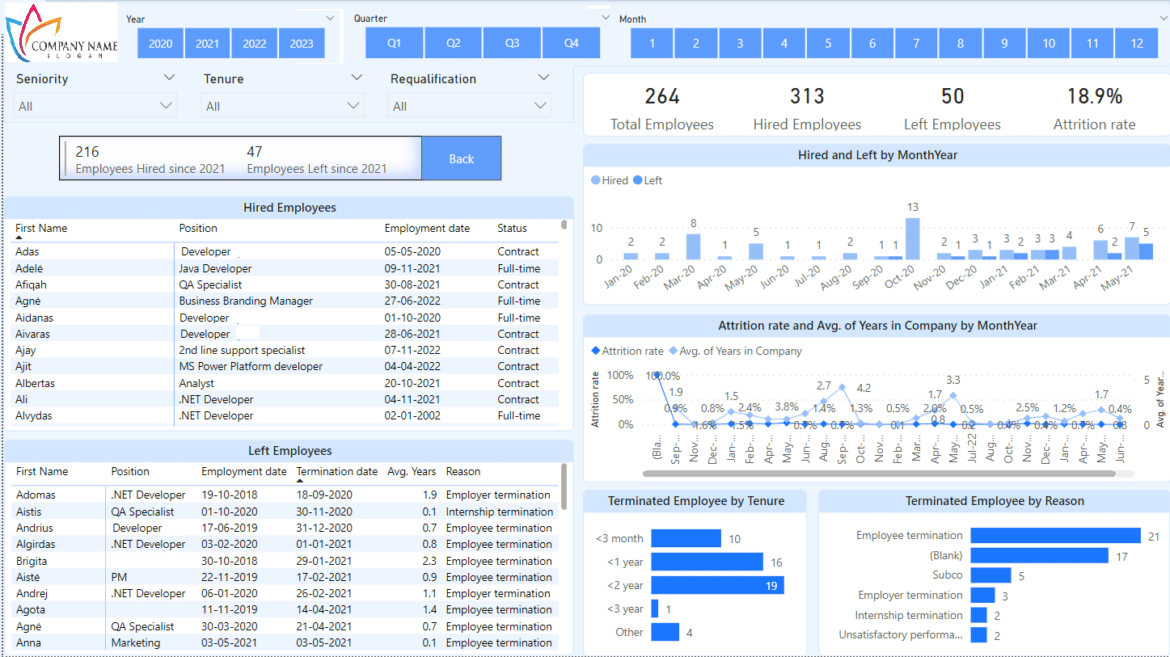
Another type of report you can build using Power BI is the HR analytics dashboard.
The HR analytics report gives you a clear understanding of different human resource metrics. This includes employee turnover, recruitment efficiency, and employee demographics. These reports help HR departments improve the retention and overall management of employees. It ensures that the company retains its valuable staff. With these insights, HR can improve salaries and benefits, and make the workplace conducive, leading to a happier team.
Key features:
According to Philip Kotler, a marketing author, consultant, and professor emeritus, “a profitable customer is a person, household or a company that overtime, yields a revenue stream that exceeds by an acceptable amount the company’s cost stream of attracting, selling and servicing the customer.”
By that definition, businesses can use customer profitability reports to identify their most valuable clients. They can pinpoint which groups bring in the most revenue and understand the reasons behind their high value by examining customer data.
Knowing this lets businesses tweak their marketing and sales to fit what their best customers want and need. They can make the customer experience more personal and interesting, which helps keep customers loyal.
Key features:
After focusing your marketing efforts on attracting profitable customers, you’ll definitely want to know how well those efforts are working, right?
A digital marketing report Power BI does just that. It gives a complete view of your online marketing activities.
This Power BI report type lets you check how your campaigns are going, see how they are performing, and find ways to make them better. You can adjust your campaigns for different groups and improve your marketing to get better results.
Key features:
Curious About Power BI Report Types?
Explore 12 distinct report types to cater to various business needs and roles.

The sixth on our list of Power BI report types is the website analytics report. Website analytics reports monitor visitor activities on your website and keep an eye on key web metrics like page views, user sessions, and bounce rates. By looking at these metrics, businesses can understand how users behave and spot where they need to get better.
For instance, a page with many people leaving quickly might need better content or more exciting features. These reports also show which content does the best, so companies can make more of what people like. Making the website easier to navigate based on these insights can help visitors find what they need, stay longer, and lead to more sales.
Key features:
Also Read: Power BI for Digital Marketing
While Power BI reports are used for detailed data exploration, dashboards serve a different purpose: providing a high-level overview at a glance. Dashboards in Power BI consolidate visuals from one or more reports, offering a snapshot of business performance.
Dashboards are especially useful for executives and team leads who need to monitor key metrics across departments without drilling into full datasets.
Types of Power BI Dashboards:
Key Features:
Microsoft Power BI’s KPI dashboards offer an easy way to view key metrics at a glance for executives and managers to quickly track how their goals are performing. The dashboards show important data points clearly and straightforwardly.
This helps leaders assess performance quickly to make well-informed decisions. It is designed to present information in a way that’s easy to understand, which is essential for making quick and effective choices.
Key features:
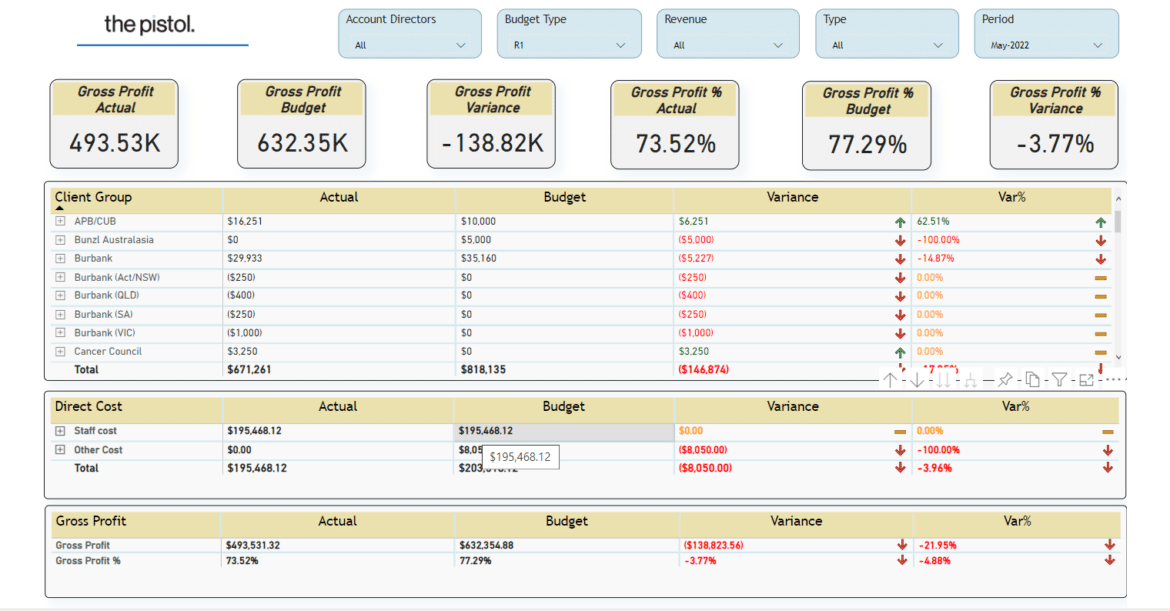
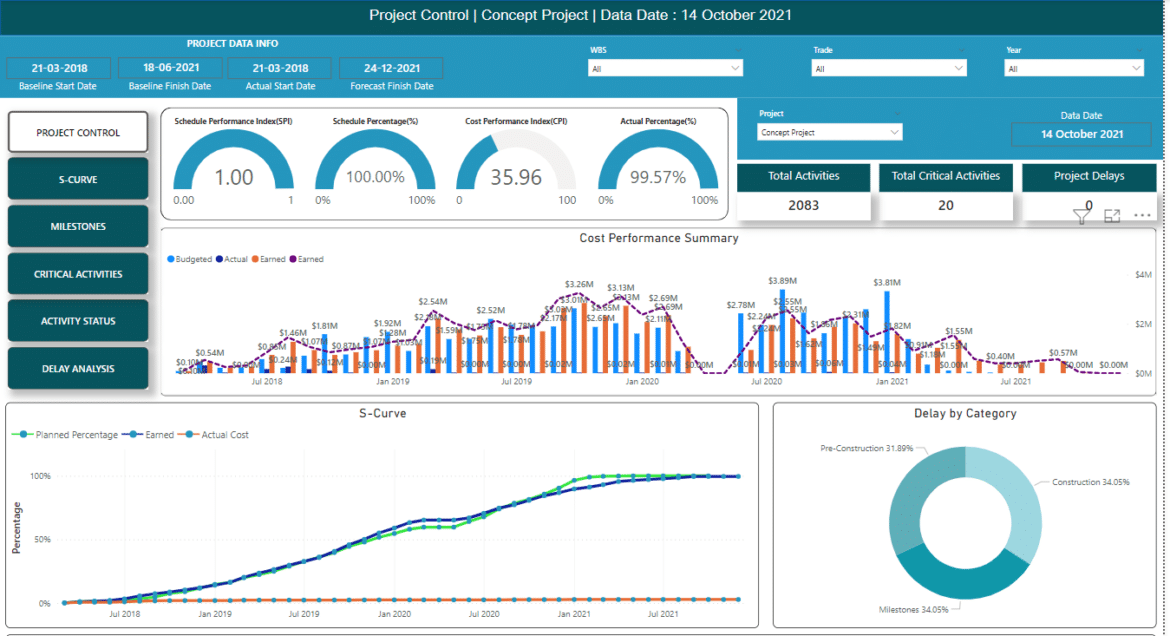
Not all data points are equal and in Power BI, variance analysis reports show the differences between actual performance and what was budgeted or forecasted. These reports are essential for businesses to understand why there are performance gaps and to pinpoint areas that need improvement in their budgeting process.
Key features:
Market Share Analysis Reports provide insights into a company’s position within its industry. These reports analyze market trends, competitive performance, and market share changes over time.
Track market trends and compare how companies are performing against each other helping businesses identify growth opportunities.
Key features:
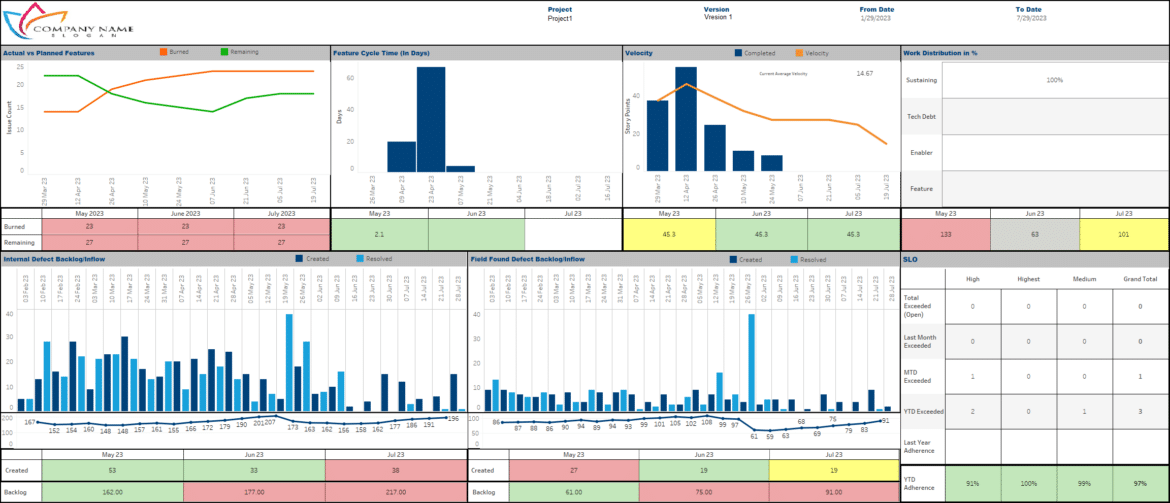
Running a business can be complicated. A lot of things can influence how well it runs. One way to understand these influences better is by using key driver analysis reports in Power BI. Businesses can zero in on critical areas like customer satisfaction, operational efficiency, and product quality by pinpointing what drives success.
This focus allows them to tweak their strategies to get better results. Using these reports, you can see what truly impacts your business numbers. For instance, if customer satisfaction is a big factor, you might want to improve your customer service.
Key features:
If you want to explore the full list of report examples you can create using Power BI, you can check our blog on the top 20 Power BI report examples here.
Paginated reports are ideal for highly formatted, print-ready reports that need to fit standard page sizes like A4 or letter. Think of them as the go-to solution for creating documents such as invoices, financial statements, regulatory forms, and HR payroll summaries.
While most Power BI reports focus on interactive dashboards, paginated reports are pixel-perfect. This means every column, row, and header will appear exactly as intended—making them perfect for documentation, audits, and exports.
These reports are built using Power BI Report Builder, a companion tool designed specifically for generating paginated content. You can embed them in Power BI service, schedule regular delivery via email, or export them to formats like PDF and Excel.
Key features:
Also Read: How to Measure Your Business Success With Power BI?
As shown in the above-mentioned Power BI report types, each one caters to specific requirements. There are various Power BI reports that serve different needs and purposes making it important to pick the right type based on your requirements.
This ensures that the data you present is both useful and simple to grasp, so people can take action on it.
Selecting the appropriate report type can make a big difference in the clarity and usefulness of the data provided, and we can’t emphasize enough on this.
When you align reports with what the business specifically needs, they can offer clear insights that intend to help organizations make decisions that are more informed and effective. For instance, a Sales Analysis Report might show trends and performance metrics.
Power BI has different kinds of reports that can be customized to meet the needs of any business by ensuring that companies can only see the data that matters to them by tweaking these reports. This makes it easier for everyone to concentrate on the most important facts and figures
Take HR Analytics Reports as an example. They can be adjusted to follow how effective hiring processes are, how well employees are doing, and how often staff leave the company. This means HR teams get exactly the information they need to improve how they work and make better decisions.
Power BI reports have an interactive and visually appealing interface that helps users better engage with and understand data. Choosing the right type of report is important because it makes complex data easier to grasp for everyone in the organization.
For example, KPI Dashboards provide a real-time view of key performance indicators in a simple format. This is particularly useful for executives who need to quickly evaluate performance and make decisions.
Also read: Power BI Report Builder
Here are some important points you need to consider when choosing the right Power BI report type:
Every business decision becomes sharper when backed by clear, actionable insights. From tracking sales performance to enhancing customer loyalty, the 12 types of Power BI reports discussed here empower organizations to harness data effectively.
Remember: the right Power BI report type doesn’t just display data—it transforms it into a strategic asset. By customizing reports to meet specific needs, you enhance decision-making, improve team engagement, and ultimately achieve your business goals.
Now is the time to make your data work harder for you. Whether it’s through real-time insights, KPI tracking, or detailed variance analysis, Power BI can be your key to staying ahead in a competitive market.
Ready to take the next step? Partner with ScaleupAlly to create smart, data-driven Power BI reports tailored to your needs. Your journey to data excellence starts here.
Q: What are the benefits of using Power BI reports?
Power BI reports come with many advantages. They turn complex data into clear visuals, making insights easy to understand. This helps users make decisions based on data, simplifying the analysis process and improving overall efficiency.
Q: What are some common challenges faced when creating Power BI reports?
Some common challenges you will face include: selecting the right report type for the audience while ensuring the data is secure and accurate. Additionally, balancing clear concise visuals without information overload.
Q: How can I ensure my Power BI reports are secure?
You can implement user permissions to restrict access to specific reports or datasets. Additionally, row-level security can be leveraged to limit data visibility based on user attributes. Data encryption provides another layer of protection for sensitive information.
Q: Can Power BI reports be refreshed automatically with new data?
Yes. Power BI allows you to schedule data refresh automatically for your reports. This will ensure access to the most recent information for everyone. This also focuses on data-driven decision-making based on the latest insights.
Q: What are some best practices for designing effective Power BI reports?
Be clear by using visuals, short labels, and good formatting to prevent too much information from confusing viewers. Highlight key insights to guide users towards the most important takeaways. Finally, consider enabling interactivity to empower users to explore the data and answer their questions, fostering a deeper understanding of the information presented.

Related Blogs

Data Warehouse Cost Breakdown: Factors, Pricing Models & Platform Comparison
Discover how much a data warehouse costs in 2025. Explore pricing models, key factors, and platform comparisons to plan your data budget effectively.
Tarsem Singh
Nov 6 ,
14 min read

How Much Do Integrations Cost? [Pricing Breakdown & Key Insights]
Learn how much integrations cost, key factors influencing pricing, hidden expenses to avoid, and effective ways to reduce integration costs.
Tarsem Singh
Nov 6 ,
9 min read

Power BI for Inventory Management: A Comprehensive Guide
Explore the hidden power of Power BI for inventory management and how it provides businesses with powerful analytics and visualization capabilities.
Tarsem Singh
Oct 8 ,
19 min read