How to Optimize Power BI Reports? A Step by Step Guide
Tarsem Singh | June 1, 2025 , 13 min read
Table Of Content
When it comes to Power BI, performance optimization is crucial to ensure fast report loading and seamless user experience. Slow reports can be frustrating and render them useless. In this comprehensive guide, we will explore various strategies and techniques to optimize the performance of your Power BI reports, making them run up to 10 times faster.
By following these steps, you can enhance the performance of your reports and maximize their impact within your organization.
Key Takeaways
- Use the Performance Analyzer in Power BI to identify and address report bottlenecks for faster load times.
- Reduce cardinality and remove unused columns to simplify your data model and improve performance.
- Utilize DAX variables to reduce repetitive calculations and enhance report efficiency.
- Implement aggregations and DirectQuery optimizations to speed up queries and reduce data load.
- Apply best practices like limiting visuals, using filters selectively, and optimizing data refresh to boost report performance.
Quick Power BI Optimization Checklist
| ✅ Area | 🔧 Optimization Tip |
|---|---|
| Data Model | Remove unused columns and tables; reduce column cardinality (e.g., group long text fields). |
| Schema Design | Use star schema instead of flat or snowflake models for better query performance. |
| DAX Optimization | Replace calculated columns with measures, use variables to avoid redundant calculations. |
| Import vs. DirectQuery | Prefer Import mode for speed; if using DirectQuery, limit data volume and simplify relationships. |
| Query Folding | Perform heavy data transformations in Power Query early to enable query folding. |
| Visual Load | Reduce visuals per page; avoid using excessive cards, maps, or custom visuals unnecessarily. |
| Slicers & Filters | Limit slicers; use page/report filters over visual-level filters where possible. |
| Aggregated Tables | Pre-aggregate large fact tables at the source or via Power BI aggregations. |
| Performance Analyzer | Use the built-in Performance Analyzer to pinpoint slow visuals and long-running queries. |
| Incremental Refresh | Implement incremental data refresh for large datasets to reduce refresh times. |
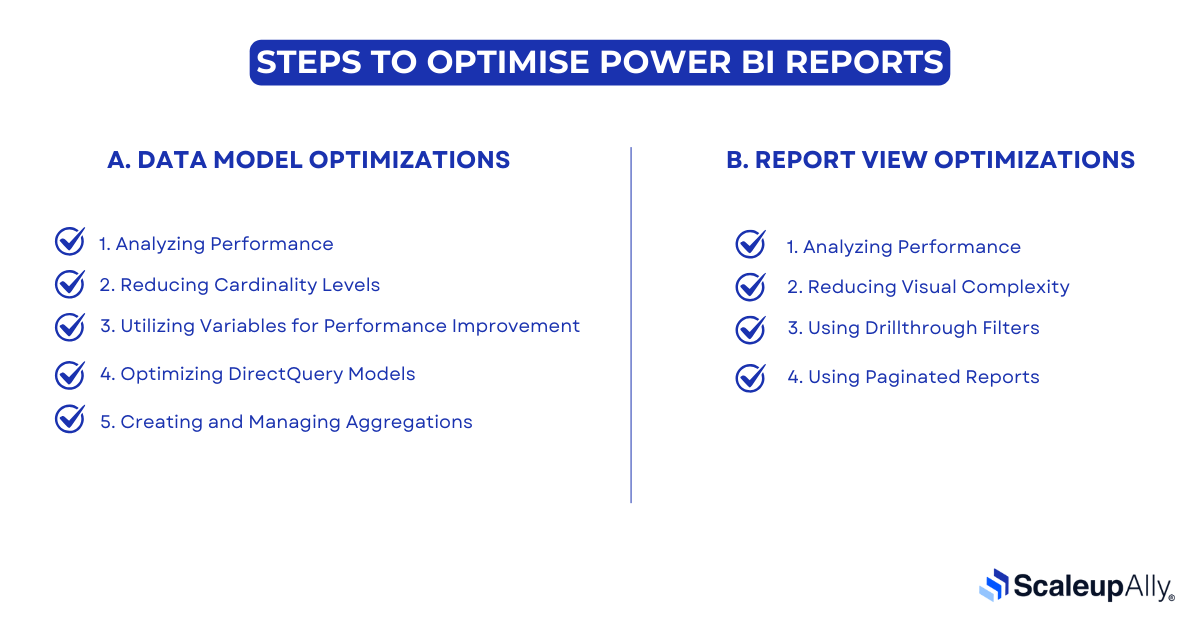
Steps To Optimise Power BI Reports

A. Data Model Optimizations
1. Analyzing Performance
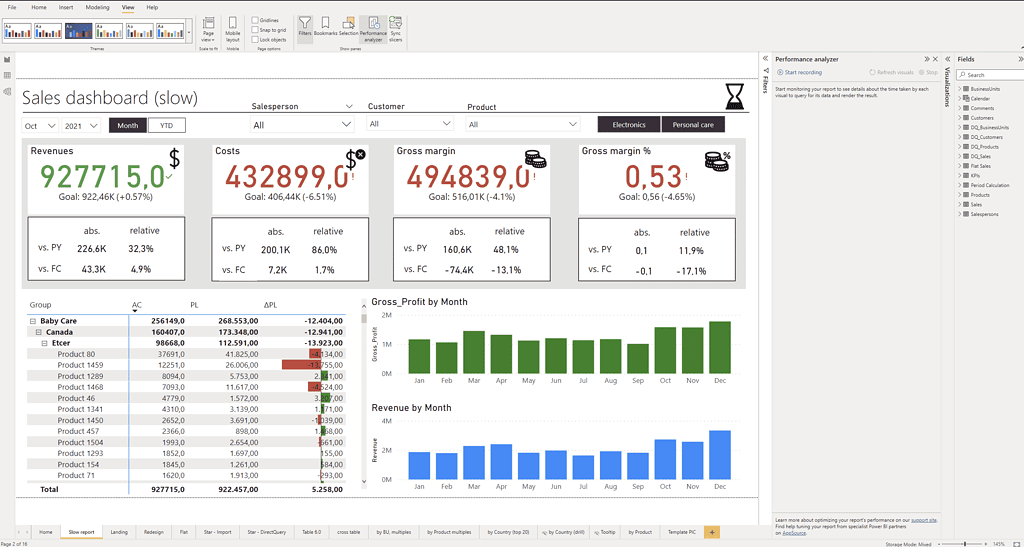
The first step in optimizing the performance of your Power BI reports is to analyze their current state. Power BI provides a built-in feature called Performance Analyzer, which allows you to measure the load time of each visual in your report. To access the Performance Analyzer, go to the View ribbon in Power BI Desktop and select Performance Analyzer.
Once the Performance Analyzer pane is open, click on “Start recording” and then “Refresh visuals” to reload the visuals in your report. The Performance Analyzer will record the load time of each visual, helping you identify any bottlenecks in performance.
The load time of each visual is displayed in milliseconds, and you can see how long it takes for each element to load. Elements such as images, lines, cards, charts, tables, and slicers contribute to the overall load time. By analyzing the load time of each element, you can pinpoint areas that require optimization.

2. Reducing Cardinality Levels
One effective strategy for improving performance is to reduce the cardinality levels in your Power BI model. Cardinality refers to the number of distinct values in a column, and high cardinality can negatively impact performance. When there are too many distinct values in a column, it requires more processing power to aggregate and analyze the data.
To reduce cardinality, you can consider grouping or categorizing data. For example, if you have a column with a large number of distinct values, you can create a new column that groups similar values together. This can help simplify the data model and improve query performance.
Additionally, you can consider removing unnecessary columns from your data model. Columns that are not used in calculations or visuals can be safely removed to reduce the overall size of the model and improve performance.
Also Read: 20 Best Power BI Report Examples For Inspiration
3. Utilizing Variables for Performance Improvement
Variables can be a powerful tool for improving performance and troubleshooting in Power BI. By using variables, you can store intermediate results and reuse them within your calculations, reducing the need for repetitive calculations. This can significantly improve the performance of complex calculations and reduce the overall load time of your reports.
To utilize variables, you can create a DAX measure that calculates the desired result and assigns it to a variable. This variable can then be referenced within other measures, reducing the need for recalculations. By reducing the number of calculations performed, you can optimize the performance of your Power BI reports.
4. Optimizing DirectQuery Models
If your Power BI model uses DirectQuery, there are additional strategies you can employ to optimize its performance. DirectQuery allows you to query data directly from the underlying data source, without importing it into the Power BI model. This can be useful for large datasets or scenarios where real-time data is required.
To optimize DirectQuery models, you can leverage table-level storage. By default, DirectQuery models retrieve data from the underlying data source for each visual, which can result in slower performance. However, by enabling table-level storage, Power BI will store a copy of the data in a cache, reducing the need for repeated queries and improving performance.
You can enable table-level storage by going to the Model view in Power BI Desktop, selecting the desired table, and enabling the “Store data in the model” option. This will create a local copy of the data in the Power BI model, improving the performance of DirectQuery visuals.
5. Creating and Managing Aggregations
Aggregations can be a powerful technique for improving performance in Power BI reports that utilize large datasets. Aggregations allow you to precalculate and store summarized data at different levels of granularity, reducing the need for complex calculations during query execution.
To create an aggregation, you can define a new table in your Power BI model that contains the summarized data. This table can be based on existing tables in your model and can include calculated columns and measures that provide the desired level of granularity.
Once the aggregation table is created, you can configure Power BI to use it for query execution. This can be done by specifying the aggregation table as a “source table” for the visuals that require the summarized data. Power BI will then automatically route queries to the aggregation table, improving performance by avoiding unnecessary calculations.
Managing aggregations involves monitoring and refreshing the aggregated data to ensure its accuracy. You can schedule regular refreshes of the aggregation table to keep it up to date with the underlying data.
Struggling with Power BI Speed?

B. Report View Optimizations
1. Analyzing Performance
Once you have optimized your data model, the next step is to optimize the report view. The Performance Analyzer can also be used to measure the load time of each visual in your report. By analyzing the load time of each visual, you can pinpoint areas that require optimization.
2. Reducing Visual Complexity
One effective strategy for improving performance in the report view is to reduce the visual complexity. This can be achieved by removing unnecessary visuals, simplifying visuals, and reducing the data displayed in each visual.
3. Using Drillthrough Filters
Drillthrough filters can be a powerful tool for improving performance in Power BI reports. They can reduce the amount of data displayed in a visual, making it load faster. Drillthrough filters allow users to click on a data point and drill down for more detailed information.
4. Using Paginated Reports
Paginated reports can improve performance in Power BI reports requiring high-fidelity printing or PDF generation. They are optimized for printing and can easily handle large datasets. By using report builder you can create paginated reports improve the performance and provide a better user experience.
What Slows Down Power BI Reports?
Several factors can slow down Power BI reports, including large data, complex calculations, high cardinality levels, inefficient data models, and inadequate hardware resources. Additionally, using DirectQuery and real-time data can negatively impact report performance. Identifying and addressing these bottlenecks can optimize your reports’ performance and improve the user experience.
External Tools to Optimize Power BI Reports
In addition to the built-in Performance Analyzer, there are external tools that can further optimize the performance of your Power BI reports. These tools provide advanced capabilities for analyzing, monitoring, and troubleshooting performance issues.
One such tool is DAX Studio, a free and powerful tool for analyzing DAX queries and evaluating their performance. DAX Studio allows you to profile and optimize your DAX code, identify bottlenecks, and visualize query execution plans. By using DAX Studio, you can gain deeper insights into the performance of your Power BI reports and make targeted improvements.
Another useful tool is the Power BI Performance Analyzer developed by Zebra BI. This tool provides a comprehensive analysis of your Power BI reports, highlighting areas that require optimization. It offers actionable recommendations and provides a checklist to guide you through the optimization process.
Best Practises to Optimize Power BI Reports Performance
Alongside the specific strategies and tools mentioned above, there are several best practices that you should follow to optimize the performance of your Power BI reports:
1. Minimize the use of visuals: Using too many visuals in a report can significantly impact performance. Consider removing unnecessary visuals or consolidating them into fewer, more meaningful ones.
2. Limit the use of custom visuals: Custom visuals can add value to your reports, but they can also introduce additional complexity and impact performance. Use custom visuals judiciously and ensure they are optimized for performance.
3. Optimize data loading: Pay attention to how data is loaded into your Power BI model. Use query folding to push data transformations and filtering operations to the data source, minimizing the amount of data brought into Power BI.
4. Apply filters and slicers selectively: Filters and slicers can be powerful tools for interactivity, but excessive use can lead to slower performance. Apply filters and slicers selectively to limit the amount of data processed by your visuals.
5. Monitor and optimize data refresh: Regularly review and optimize the refresh process for your Power BI reports. Minimize the amount of data refreshed and schedule refreshes during off-peak hours to avoid performance issues.
Optimize the performance of your Power BI reports and deliver a seamless user experience by following these best practices and implementing the strategies and techniques outlined in this guide.
Conclusion
Optimizing the performance of your Power BI reports is crucial for fast and efficient data analysis. This comprehensive guide outlines steps to identify bottlenecks, use optimization techniques, and leverage external tools for improved report speed and responsiveness. Remember to apply best practices and regularly monitor your Power BI reports’ performance to ensure an exceptional user experience. With these optimization strategies, you can unlock Power BI’s full potential and make data-driven decisions effortlessly.
Looking to outsource your Power BI optimization efforts, choose Scaleupally as your partner for comprehensive Power BI services. Unlock the full potential of this powerful data analysis tool today!
Frequently Asked Questions
Q: Why is it important to optimize Power BI reports?
Optimizing Power BI reports improves responsiveness, reduces loading times, and enhances overall usability, crucial for delivering valuable insights to users.
Q: How can I optimize report layout and design in Power BI?
To optimize report layout and design, use a clean and intuitive design, avoid overcrowding visuals on a page, and use colors and formatting to highlight key insights.
Q: What tools and resources are available to help optimize Power BI reports?
Microsoft provides several tools and resources, such as the Performance Analyzer in Power BI Desktop, DAX Studio for analyzing DAX queries, and the Power BI Community for tips and best practices.
Q: What are some best practices for ongoing optimization of Power BI reports?
Some best practices for Power BI report optimization include regularly reviewing and optimizing DAX calculations, monitoring report performance, and seeking user feedback to identify areas for improvement.
Q: What modeling technique optimizes performance in Power BI?
The Star Schema modeling technique can be used for performance optimization in Power BI by organizing data into fact and dimension tables. This structure reduces complexity, improves query performance, and enhances the overall efficiency of reports and dashboards.
Related Blogs

Power BI Cost: Comprehensive Guide to Pricing Plans
Compare different types of Power BI Licenses and their costs: Free, Pro, and Premium options explained. Discover which Power BI plan suits your business needs.
Tarsem Singh
Jun 30 ,
12 min read

Power BI Consultant Hourly Rates: How Much Does It Cost?
Struggling to understand the cost of hiring a Power BI consultant? Find out the Power BI consultant hourly rates, what factors influence the price and how to find the best value for your business.
Pranay Agrawal
Jun 30 ,
15 min read

Power BI Implementation: A Step-by-Step Guide for Businesses
Discover how to implement Power BI in your organization with this comprehensive guide. Learn essential steps and best practices for successful implementation.
Tarsem Singh
Jun 30 ,
12 min read


