11 Powerful Power BI Dashboard Examples for Better Analytics
ScaleupAlly Team | October 6, 2024 , 16 min read
Table Of Content
Power BI is one of the most popular Business Intelligence (BI) tools used by companies to make data-driven decisions. It transforms raw data into actionable insights with the help of rich, customizable visualizations presented on interactive dashboards.
These visuals provide clarity and support key decision-making processes across various industries.
As businesses generate more data each day, the need for clear, compelling data presentations is important. Power BI excels at organizing and presenting this data in a way that helps companies make informed decisions quickly.
In this blog, we will showcase 11 powerful Power BI dashboard examples that are widely used in different industries. Each template will highlight how it turns raw data into valuable insights and demonstrate its capabilities for improving business performance.
Metrics for a Powerful Dashboard
When a Power BI Dashboard was built by Microsoft, there were certain metrics that were kept in mind with the focus of delivering effective results from the visuals. Keeping these metrics in mind is crucial for developing effective Power BI dashboards, as you’ll see in the examples below. These Metrics are outlined as below:
1. Know your Audience
Before building a Dashboard, it’s essential to understand your target audience and their specific needs. Different dashboards would have different audiences each serving a unique purpose, but an effective dashboard is one that clearly communicates relevant insights and information to its end users, helping them make informed decisions.
2. Data Flow
When the user accesses the Dashboard, then the Load time matters a lot for the data to be generated in the Visuals. A faster Load time improves the User experience and can be achieved by following ways:
- Removing unnecessary clutter
- Storing Data Transformations in views
- Balancing complex and simple visualizations
3. UI Layout
When viewing the Dashboard, the user would expect the Visuals to depict clear information from vast amounts of data. The UI of the Dashboard can be improved by:
- Grid Layout: Adapting this layout helps users follow a smoother journey and navigate the dashboard intuitively from left to right and top to bottom.
- Aesthetics Matter: When designing the visuals in the Dashboard, there are following factors that need to be kept in mind to make them appealing:
- Font type
- Font color
- Font size
4. User Interactivity
An end user should find the Dashboard easy to navigate without encountering any unnecessary clutter so that he/she is quickly able to identify key metrics from the information in the Dashboard and accordingly make decisions.
Curious About Power BI Capabilities?
Understand the features that make Power BI a leading BI tool.

Power BI Dashboard Examples
Now that we know the basics of the Dashboard and its features, let’s look at some real-world examples of Power BI Dashboard applications:
1. Sales Performance Dashboard
This Power BI Dashboard example illustrates how key sales metrics can be visualized Here we will discuss the Sales being made for the product and how one can ensure that the right product is sold to the right person and in the right place.
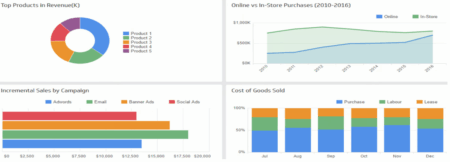
To determine the performance of the product in the market, we have built various key metrics that would help the companies in achieving their sales targets:
1. Product Performance:
- This KPI is used in the “Top Products in Revenue(K)” visual that ranks the sales of the product based on its Revenue and how well it is selling in the market.
- By using this metric one can determine which product meets the Customer Expectations and which doesn’t.
2. Incremental Sales:
- It reflects the extra sales generated by marketing activities other than what would have naturally churned without those efforts.
- With the chart used here (i.e. Incremental Sales by Campaign), one can determine the relationship between different sales activities and how it affects the companies.
3. Point of Purchase:
- From this metric, we can find out where the customers are making purchases and how the trends are being followed in the market when the retail transactions are being made.
- The Chart used here (i.e. Online vs In-Store Purchases (2010-2016)) determines the purchases being made at the macro level between Online and In-store over a given period.
4. Cost of Goods Sold:
- This metric helps the companies understand the costs incurred when producing a particular product and how it affects overall performance.
- Using this metric, one can determine the costs incurred by a moving product from production to consumption.
2. Financial Performance Dashboard
With the visual representation of key financial indicators, this dashboard provides an overview of the organization’s economic health and performance. In this Dashboard, the data is collected from various financial sources and consolidated in one single interface, thereby becoming an effective tool for different stakeholders to assess the financial status of the company.
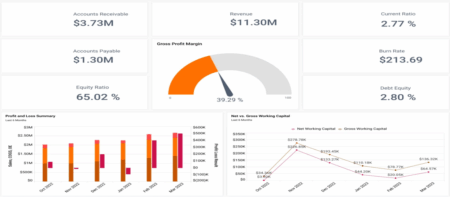
The key metrics used in this Dashboard can be summarized as follows:
1. Accounts Payable and Account Receivable:
- Using these metrics, the users can view and understand how much is owed to the company, and how much the company owes. This gives an overview of the internal payment book.
- The visuals prepared in this Dashboard for the given metrics help companies to ensure that resources are allocated appropriately.
2. Key Balance Sheet Figures:
To provide a complete picture of the financial performance of the company, the main metrics used in this Dashboard are as follows:
- Revenue: Total income generated by the business.
- Current Ratio: This helps measure a company’s ability to cover short-term liabilities with short-term assets.
- Equity Ratio & Debt Equity: It is debt-to-equity ratio, measures the amount of leverage used by the company and compares the liabilities.
3. Customer Insights Dashboard
This Dashboard is a visual representation of the data containing customer behavior or preferences around a particular product or service. The idea behind it is to provide the business insights around the activities of the Customer in form of different metrics such as:
- Customer satisfaction
- Purchasing patterns
- Feedback
- Level of engagement
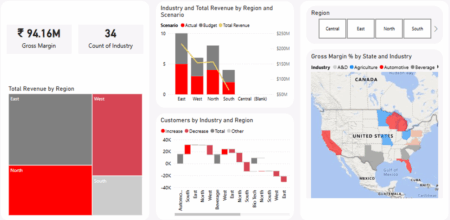
The example we used here shows its main emphasis on Customer behavior by Region and how they react towards the product across different industries. The Chart shown above helps the business to make informed decisions by identifying:
- Total Revenue generated
- Which Region had highest/lowest Customers
- Which Region made most/least Profit
- Trends being followed by Customer behavior towards the Product
4. Marketing Campaign Performance Dashboard
A Marketing campaign involves a series of strategic efforts made by the marketing channels to achieve a business goal. To find out how well the Campaign is performing, following are the steps that need to be taken:
- Identify all campaign channels
- Determine Key Performance Indicators (KPIs)
- Track conversions
- Assess actual vs planned results
- Monitor results
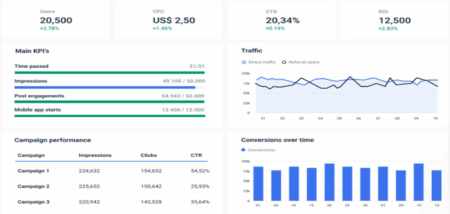
The Dashboard example we used involves an overview of key performance indicators (KPIs) and how it can help the marketers make informed decisions for executing their marketing strategy.
The Key Metrics that were used here are as follows:
- CPC (Cost Per Click): Used to measure the cost advertisers pay for each click on their ads
- CTR (Click Through Rate): This metric tells how often the users click on the content from a search result, ad or email
- ROI (Return on Investment): Used to evaluate the profitability of an investment
In addition to these metrics, the end user is also able to identify the performance of each campaign and how well the conversions are being from different traffic sources from time to time.
With the ever-changing era of marketing, analyzing campaign performance is more around uncovering actionable insights from different marketing metrics which helps in identifying hidden opportunities, optimize strategies and propel the campaigns to new heights of success.
5. HR and Employee Analytics Dashboard
The performance of the business is always based on its employees and how well it impacts the market. Here, we will explain how the given Dashboard in terms of the employee performance and the metrics that are considered for the same.
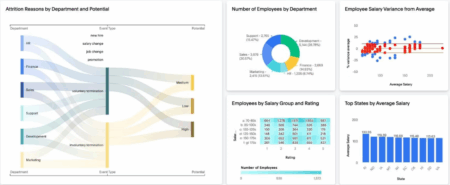
The Dashboard represented here offers a real-time view of KPIs related to employee or team performance within an organization which help the Managers and the HR team to identify:
- Attrition Rate in the Department
- Total Employees by Department, State and Salary Gaps
- Top States by Average Salary
With available information, the companies can find the potential within their employees and the necessary training or coaching that is to be needed.
Also, in most industries one or all the following performance metrics must be tracked when measuring individual or team performance.
- Quantity: Amount of work produced.
- Quality: Standard of work compared to others.
- Efficiency: Ratio of input (time and money) to output (products or services).
- Effectiveness: Impact of the work produced.
By adapting the above metrics, the companies are able to find out whether their employees are meeting the business goals effectively.
6. Project Management Dashboard
The idea behind this Dashboard is to transform workflows i.e. from rationalized communication to identifying risks before they hit deadlines.
With the amount of projects handled by the employees in the company, this dashboard helps the company to view the performance of all projects in one central location.
The Dashboard carries out the following benefits when optimizing the project performance:
- Crystal clear visibility
- Better communication
- Performance tracking
- Increased efficiency
- Informed decisions in a flash
With these benefits and the visual representation of the project related information in the Dashboard, one can grasp:
- Project Status
- Progress made
- Potential risks associated
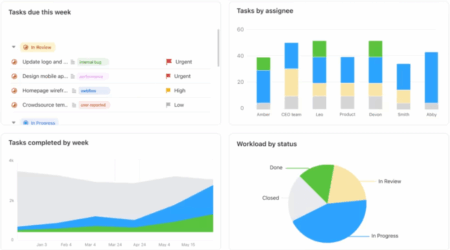
To best explain how the project management can be done, we will be representing the above Dashboard that provides a view of total tasks due by the week, the workload status, and the tasks being assigned.
With the visuals represented in given Dashboard, the companies are able to draw the following insights about the employees and their tasks:
- Which tasks the employees are working on?
- What is the Status of the tasks?
- What is the progress made on the tasks?
- What is the total workload capacity?
Through these insights, the companies are able to enhance their decision making when achieving business goals or objectives.
7. Manufacturing Dashboard
This Dashboard acts as a tool for tracking the productivity levels of a manufacturing process while also spotting the areas of improvement. The data used in this Dashboard comes from multiple sources within a manufacturing setup including:
- Machinery output
- Quality control metrics
- Inventory levels
and the visuals prepared at one place using this data helps the stakeholders draw valuable insights.
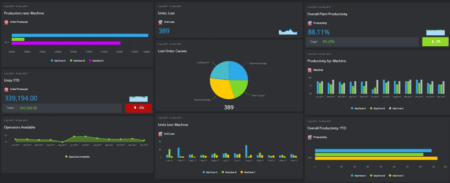
From the above example, a clear explanation of the manufacturing process is given out in terms of different KPIs such as:
- Production Rate
- Units Lost
- Machine / Plant Productivity
- Operator Productivity
- Units created
- Productivity by location
- Defects by Cause
From the given Dashboard, a business can draw out the following benefits:
- Monitoring efficiency in the production process.
- Forecasting and capacity planning.
- Be alerted of any problems during production.
- Real-time feedback of operating levels for machinery.
Using this Dashboard can help the companies to monitor and optimize their operations, which in turn would drive the growth for their business.
8. Supply Chain Dashboard
In the modern era today, supply chain operations are vital for most businesses when monitoring the flow of goods from supplier to customer effectively.
With the use of the Dashboard prepared using Business Intelligence tool, tracking the given flow has become more easier, thereby leading to improved service levels and reduced costs.
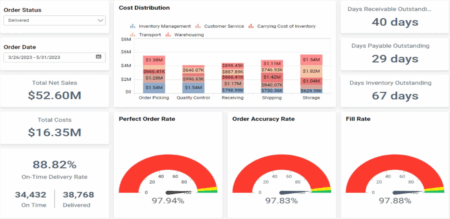
To get a better understanding of the company supply chain operations, we will be carrying out an example shown above, displaying the performance in terms of the key order metrics.
9. Customer Service Dashboard
Whenever a customer wants to get their issue revolving around a product or service of the business to be resolved, they mostly turn over to the Customer service department of the Organization.
However, today most customer service representatives face the challenge of delivering exceptional experiences across many channels.
To best manage this complexity, customer service dashboards were introduced that help in tracking activities or metrics from each channel and transforming raw data obtained into actionable insights. These dashboards provide the following benefits to the business:
- Improved Decision-Making
- Enhanced Efficiency
- Increased Customer Satisfaction
- Empowered Agents
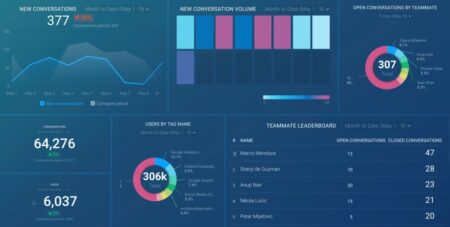
To best explain how the Dashboard can be useful for the internal team management and customer service operations, we will bring it through the Customer Support Dashboard shown in the above image.
The Customer Support Dashboard is crucial when it comes to identifying how well your team is addressing customer issues. Addressing these issues helps to show the customers how much you value them and thereby improves your position in the market.
Below are some of the main KPIs that were put in one place to improve the support services:
- Number of New Conversations
- New Conversation Volume
- Open Conversations per Teammate
- Net Conversion Score
Using these metrics has helped in keeping track of the performance of different departments of the organization.
10. e-Commerce Performance Dashboard
In the Online era today, most of the products are being purchased from the e-commerce websites, but with a lot of traffic generated on a daily basis, tracking the activities on these sites becomes a complex process.
In this scenario, an eCommerce Dashboard acts as the visual aid for analyzing the activities in the form of different KPI metrics. This dashboard carries out the following benefits for online business:
- Real-time Insights
- Better Communication and Collaboration
- Performance Monitoring
- Better Decision Making
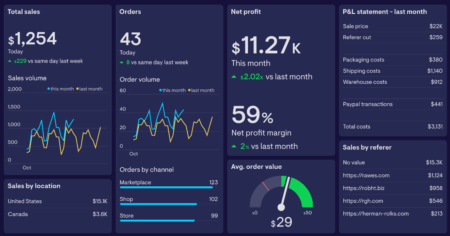
The above dashboard explains the eCommerce operations in the form of various KPIs that give the online sellers an overview of store performance and how to optimize every stage of the customer journey i.e., from first touch to purchase.
The KPIs given out here are as follows:
- Total Revenue
- Orders
- Average Order Value
- Profit Margin
- Profit & Loss statement
With the help of the given KPIs displayed at one place in the Dashboard provides aid to the business in keeping track of their performance in different areas and how they can enhance their business growth.
11. IT Operations Dashboard
Most companies have an IT department responsible for monitoring their IT infrastructure to ensure smooth business operations. To support this department, an IT Operations Dashboard has been introduced that offers the real time insights in their daily activities.
This Dashboard carries out the following benefits:
- Real-time monitoring
- Data-driven decision making
- Security monitoring
- Efficient resource allocation
- Compliance and governance
To best represent the workings in the IT infrastructure of the company, we will be sharing the above example that brings out different metrics that can be tracked when monitoring the hardware and software operations that power up the company.
The key metrics used in this dashboard are:
- IT spend vs plan
- Incidents
- New people in last 30 days
- User growth
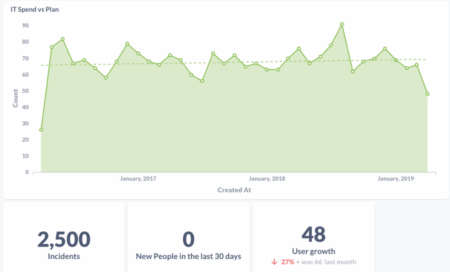
The insights obtained from these metrics ensure that the IT operations are running smoothly and efficiently in the company by minimizing downtime and enhancing overall performance.
Conclusion
Reaching the end of the blog, we have learnt a complete overview of the Power BI dashboard and the key metrics to consider when creating one. The Power BI dashboard ideas illustrated here demonstrate how beneficial this tool in the modern business landscape.
The Power BI dashboard illustrates its use in different areas and how well it is beneficial in the Corporate World. With its use the end user can obtain valuable insights from the daily workings in different departments of the Organization.
Adapting this Business Intelligence tool has helped in automating the manual processes of the business and has also driven growth.
We at ScaleupAlly assist businesses with their Power BI needs, helping them harness the full potential of their data.
Frequently Asked Questions
Q: What is the difference between a Power BI dashboard and a report?
A Power BI dashboard is a canvas where one can pin visualizations from the reports from multiple sources while a report is a collection of visualizations from a single dataset. A dashboard is a single page, while a report can have multiple pages.
Q: How do I create a simple dashboard in Power BI?
In these simple five steps, you can bring your power bi dashboard ideas to life:
1. Select the dataset you want to represent visually.
2. Connect to your data sources using the “Get Data” option.
3. Import and transform your data using Power Query.
4. Create relationships between different tables.
5. Visualize the data.
Q: What are the different types of Power BI services?
There are three main types of Power BI services:
1. Power BI Desktop: A desktop application for creating reports and visualizations on the local machine.
2. Power BI Service: A cloud-based platform accessible via a web browser for sharing and collaborating on reports.
3. Mobile Power BI: A mobile app available for tablets and smartphones, enabling users to access reports and dashboards on the go.
Q: What are the mistakes to avoid in Power BI Dashboard design?
To create effective Power BI dashboards, avoid these common mistakes:
1. Choosing inappropriate charts for your data.
2. Poor labeling, which can confuse users.
3. Overusing filters or slicers.
4. Inconsistent use of colors.
5. Displaying unnecessary variances.
6. Confusing page layouts.
7. Not scaling charts properly.
Q: What key metrics should be included in a Power BI Dashboard for supply chain operations?
A Power BI dashboard for supply chain tracking should include metrics like:
1. Perfect Order Rate: Percentage of orders delivered without errors or deviations.
2. Order Accuracy Rate: The number of orders fulfilled and shipped without mistakes.
3. Fill Rate: The percentage of orders fulfilled from available stock, avoiding stockouts or backorders.
Author Spotlight
Kaustubh Verma, Data Analyst I

Related Blogs

Data Warehouse Cost Breakdown: Factors, Pricing Models & Platform Comparison
Discover how much a data warehouse costs in 2025. Explore pricing models, key factors, and platform comparisons to plan your data budget effectively.
Tarsem Singh
Nov 6 ,
14 min read

How Much Do Integrations Cost? [Pricing Breakdown & Key Insights]
Learn how much integrations cost, key factors influencing pricing, hidden expenses to avoid, and effective ways to reduce integration costs.
Tarsem Singh
Nov 6 ,
9 min read

Power BI for Inventory Management: A Comprehensive Guide
Explore the hidden power of Power BI for inventory management and how it provides businesses with powerful analytics and visualization capabilities.
Tarsem Singh
Oct 8 ,
19 min read