Power BI Forecasting: How To Do It The Right Way?
Tarsem Singh | April 3, 2025 , 20 min read
Table Of Content
Accurate predictions of future trends, sales, and market dynamics empower companies to make informed choices, allocate resources efficiently, and stay ahead of the competition. However, traditional forecasting methods often fall short. Let’s be honest, relying on gut feeling or cobbled-together spreadsheets isn’t exactly a recipe for reliable forecasts. They can lead to errors, biases, and missed opportunities.
These traditional methods often fall short due to limited data handling capabilities and a lack of sophisticated algorithms. Gut feelings, while valuable in some instances, can be biased and inconsistent, leading to costly mistakes. Spreadsheets, on the other hand, lack the advanced analytical capabilities required to handle large datasets and uncover patterns effectively. Imagine the possibilities if you could leverage a powerful tool that streamlines data analysis and offers built-in forecasting functionalities.
Enter Power BI, a powerful Microsoft tool that transforms data into actionable insights. With its built-in forecasting capabilities, Power BI eliminates guesswork, allowing you to analyze trends, detect seasonality, and make reliable predictions with confidence.
In this guide, you’ll discover:
- What forecasting in Power BI is and how it works
- Key features like seasonality detection, confidence intervals, and user customization
- The benefits of using Power BI for forecasting over traditional methods
- A step-by-step process to set up Power BI and create accurate forecasts
- Limitations to be aware of and best practices to improve forecast accuracy
By the end, you’ll have a clear understanding of how to leverage Power BI’s forecasting tools to make smarter, data-driven decisions.
Key Takeaways
- Power BI enables accurate forecasting by analyzing historical data, detecting trends, and predicting future outcomes.
- Built-in forecasting tools offer visualizations, confidence intervals, and seasonality detection for better insights.
- Power BI automates the forecasting process, saving time and reducing errors compared to traditional methods.
- Forecasts can be integrated into reports and dashboards for real-time analysis and decision-making.
What is Forecasting in Power BI?
- What is Forecasting in Power BI?
- Key Features of Forecasting in Power BI
- Benefits of Forecasting in Power BI
- Step-by-Step Guide to Setting Up Power BI Desktop and Using Forecasting
- Creating a Visualization for Forecasting
- Customizing Forecast Settings
- Interpreting the Forecast
- Refining Your Model
- Integrating Forecasts into Reports
- A Scenario
- Understanding Forecasting in Power BI
- 5 Advanced Forecasting Techniques in Power BI
- Best Practices for Forecasting With Power BI
- Limitations of Forecasting in Power BI
- Frequently Asked Questions (FAQs)
Power BI forecasting is a data analysis technique used to make predictions about future trends and outcomes based on historical data.This allows businesses and analysts to forecast with Power BI to anticipate future performance, identify potential risks, and make informed decisions.
Need help with Power BI forecasting? Explore our comprehensive Power BI consulting services and expereince the full potential of using Power BI.
Key Features of Forecasting in Power BI
Here’s an overview of how forecasting works in Power BI and its key features:
1. Historical Data Analysis
Forecasting in Power BI relies on historical data to predict future values. By analyzing past trends and patterns, the tool can generate forecasts that project these trends forward.
2. Visualizations
Power BI allows users to visualize forecasts through various types of charts and graphs, such as line charts, bar charts, and area charts. These visualizations make it easier to understand and interpret the forecasted data.
3. Seasonality Detection
Power BI can automatically detect seasonality in the data. This means it can recognize recurring patterns that occur at regular intervals, such as monthly or yearly trends, and incorporate them into the forecasts.
4. Confidence Intervals
When generating forecasts, Power BI provides confidence intervals, which indicate the range within which the actual future values are likely to fall. This helps users understand the potential variability and uncertainty in the predictions.
5. User Control
Users can customize forecast settings, such as specifying the number of periods to forecast, adjusting confidence levels, and selecting different algorithms or models to improve the accuracy of the forecasts.
6. Integration with Power BI Reports
Forecasts can be seamlessly integrated into Power BI reports and dashboards, allowing users to combine them with other data visualizations and insights for comprehensive analysis.
Benefits of Forecasting in Power BI
Here are some benefits of using Power BI in forecasting:
1. Increased Accuracy
Power BI’s advanced forecasting algorithms and machine learning capabilities provide highly accurate predictions, minimizing the risks associated with relying on gut feelings or simplistic spreadsheet models. By leveraging historical data and accounting for various influencing factors, Power BI forecasts are more reliable and trustworthy.
2. Time Savings
Traditional forecasting methods can be time-consuming and prone to errors, especially when dealing with large datasets. Power BI automates many aspects of the forecasting process, from data integration to model selection and visualization, significantly reducing the time and effort required for generating forecasts.
3. Scalability
As businesses grow and data volumes increase, Power BI’s scalable architecture ensures that forecasting capabilities can keep up with the demand. Its ability to handle massive datasets and complex calculations makes it a future-proof solution for organizations of all sizes.
4. Comprehensive Insights
Power BI’s forecasting capabilities go beyond simple numerical predictions. Its powerful data visualization tools enable businesses to uncover hidden patterns, trends, and correlations within their data, providing a holistic view of the forecasting process and its underlying drivers.
5. Collaboration and Sharing
Power BI’s collaborative features allow multiple stakeholders to access and interact with forecasts, facilitating seamless communication and decision-making across teams and departments. Forecasts can be easily shared and disseminated through interactive reports and dashboards.
6. Integration with Microsoft Ecosystem
As part of the Microsoft ecosystem, Power BI seamlessly integrates with other popular Microsoft products, such as Excel, SQL Server, and Azure. This integration ensures a smooth workflow and enables businesses to leverage their existing data infrastructure and tools.

Step-by-Step Guide to Setting Up Power BI Desktop and Using Forecasting
Setting Up Power BI Desktop
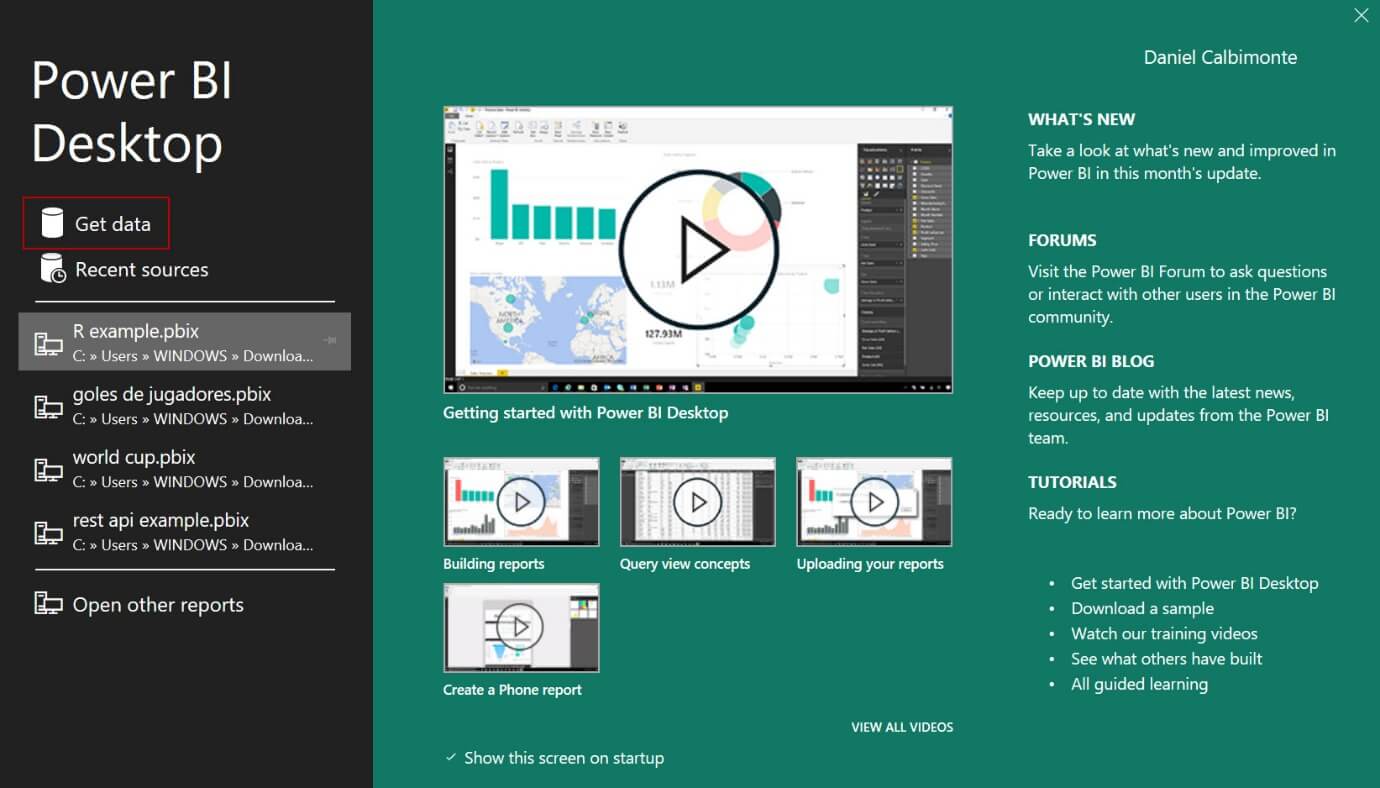
1. Download Power BI Desktop
- Visit the Website: Go to the Power BI website [Power BI Download].
- Download: Click on the ‘Download’ button to download the installer for Power BI Desktop.
2. Install Power BI Desktop
- Run the Installer: Once the download is complete, run the installer and follow the on-screen instructions to install Power BI Desktop.
- Launch Power BI Desktop: After installation, launch the application.
3. Sign In to Power BI
- Sign In: If you have a Power BI account, sign in using your credentials. If you don’t have an account, you can create one for free.
Importing Data into Power BI Desktop
1. Get Data
- Data Sources: Click on ‘Get Data’ in the Home ribbon. Power BI supports various data sources such as Excel, SQL Server, web pages, and more.
- Select Data Source: Choose your data source (e.g., SQL) and click ‘Connect’.
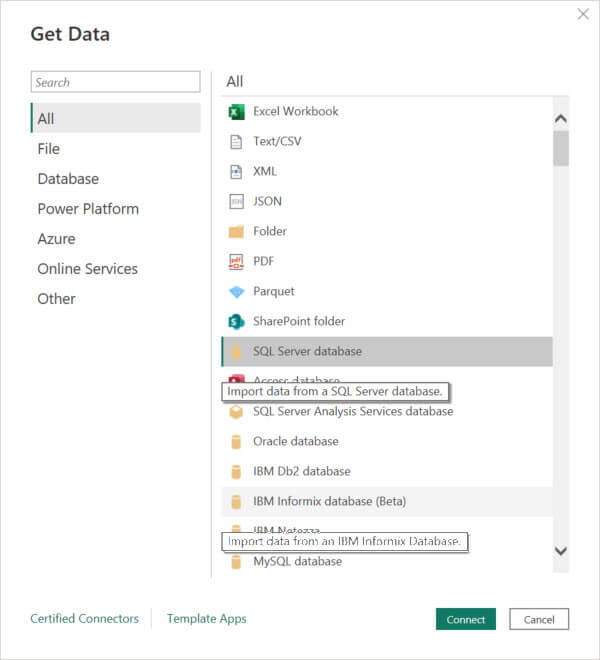
- Load Data: Navigate to your data file, select it, and load the data into Power BI.
2. Data Preparation
- Data Cleaning: Use Power BI’s Query Editor to clean and transform your data as needed. This can include removing duplicates, filling in missing values, and changing data types.
- Apply Changes: Once your data is clean, apply the changes to load the transformed data into the Power BI data model.
Creating a Visualization for Forecasting
1. Select Visualization Type
- Line Chart: Go to the Visualizations pane and select the ‘Line Chart’ icon.
- Plot Historical Data: Drag your date/time field to the Axis area and the measure you want to forecast (e.g., sales) to the Values area.
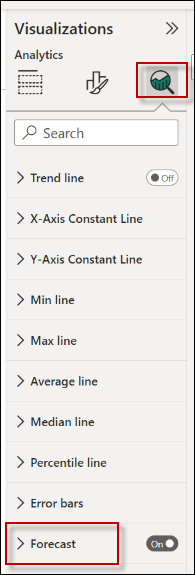
2. Enable Forecasting
- Open Analytics Pane: With your line chart selected, open the analytics pane on the right side of the screen.
- Add Forecast: Find the ‘Forecast’ section and click on the ‘Add’ button. This will add a forecast line to your visualization based on the historical data.
Customizing Forecast Settings
1. Forecast Length
Set Length: Specify the number of periods into the future you want to forecast (e.g., 6 months).
2. Confidence Interval
Adjust Confidence Level: Set the confidence interval to indicate the range within which you expect the actual values to fall. Common settings are 95% or 99%.
3. Seasonality
Enable Seasonality: Enable or adjust seasonality if your data has recurring patterns (like monthly or yearly trends). Power BI can often detect this automatically, but you can manually set the seasonality period if needed.
4. Ignore Last
Ignore Recent Data: Set Power BI to ignore a certain number of recent data points if they are incomplete or unreliable.
Interpreting the Forecast
1. Analyze Forecast Line
Forecasted Values: The forecast line extends from the end of your historical data into the future, showing predicted values.
2. Confidence Intervals
Shaded Areas: Shaded areas around the forecast line represent the confidence intervals, indicating the range within which the actual values are likely to fall.
3. Seasonal Components
Pattern Recognition: If seasonality is enabled, the forecast will reflect expected periodic fluctuations.
Refining Your Model
1. Model Comparison
Adjust Settings: Compare different forecasting models by adjusting settings and observing the changes in the forecast. Fine-tune the model to improve accuracy.
2. Validate
Compare with Actuals: Validate your forecast by comparing it against actual values as they become available. This helps in understanding the reliability of the predictions and making necessary adjustments.
Integrating Forecasts into Reports
1. Report Creation
Combine Visualizations: Incorporate your forecast visualization into a Power BI report. Combine it with other relevant data visualizations to provide a comprehensive view.
2. Dashboard Integration
Real-Time Monitoring: Add your report to a Power BI dashboard. This allows for real-time monitoring and sharing with stakeholders.
3. Annotations and Insights
Highlight Key Insights: Use annotations to highlight key insights from the forecast and provide context for report viewers.
A Scenario
Imagine you have historical sales data for the past three years, and you want to forecast sales for the next six months. Here’s how you would do it:
- Import Data: Import your sales data, ensuring it includes a date field and a sales amount field.
- Create Visualization: Create a line chart, dragging the date field to the axis and the sales amount field to the values area.
- Enable Forecasting: In the analytics pane, add a forecast and set the length to 6 months.
- Customize Settings: Adjust the confidence interval to 95%, and set seasonality to 12 if you expect monthly seasonal trends.
- Interpret Results: Analyze the forecasted sales line and confidence intervals to understand expected sales and variability.
- Integrate and Share: Add the forecast visualization to your report and dashboard, highlighting key insights and sharing with relevant stakeholders.
By following these detailed steps, you can effectively set up Power BI Desktop, import your data, create forecasts, and integrate them into your reports for actionable insights and informed decision-making.
Understanding Forecasting in Power BI
Forecasting using Power BI involves several key concepts and a structured process to generate predictions from historical data. Here’s an in-depth look at what forecasting in Power BI entails and how it works. Here’s an in-depth look at what forecasting in Power BI entails and how it works.
Key Concepts in Forecasting
- Time Series Data: Time series data is a sequence of data points collected or recorded at time intervals. Common examples include daily sales figures, monthly revenue, and annual temperature readings. Forecasting relies on time series data to identify patterns and trends that can be projected into the future.
- Trend Analysis: Trend analysis involves examining historical data to identify consistent patterns or directions over time. In Power BI, trend analysis helps to establish a baseline for forecasting future values.
- Seasonality: Seasonality refers to regular, repeating patterns or cycles in data that occur at consistent intervals, such as weekly, monthly, or yearly. Power BI can automatically detect seasonal patterns and incorporate them into the forecast to improve accuracy.
- Confidence Intervals: Confidence intervals provide a range within which future data points are expected to fall, given a specified level of confidence (e.g., 95%). They help to quantify the uncertainty and variability in the forecast, offering a clearer picture of potential outcomes.
How Forecasting Works in Power BI?
- Data Preparation
-
- Clean Data: Ensure that your data is clean, with no missing values or anomalies that could skew the forecast.
- Time Series: Organize your data as a time series, with a clear time variable and the measure you want to forecast (e.g., sales, revenue).
- Creating Forecasts
-
- Visualizations: Use a line chart or another suitable visualization to plot your historical data.
- Analytics Pane: In the visualization, go to the analytics pane and add a forecast. Power BI will use built-in algorithms to generate the forecast based on the historical data.
Customizing Forecasts
- Forecast Length: Specify how far into the future you want to forecast. For example, you might forecast sales for the next 6 months.
- Confidence Level: Adjust the confidence interval to reflect the desired level of certainty (e.g., 95% or 99%).
- Seasonality: If applicable, enable seasonality and specify the period (e.g., 12 months for yearly seasonality).
Interpreting Forecasts
- Forecast Line: The forecast line extends from the end of your historical data, showing predicted future values.
- Confidence Intervals: Shaded areas around the forecast line represent the confidence intervals, indicating the range of expected values.
- Seasonal Patterns: If seasonality is enabled, the forecast will reflect expected periodic fluctuations.
5 Advanced Forecasting Techniques in Power BI
If you’re ready to move beyond basic forecasting in Power BI, advanced techniques can offer deeper insights, greater precision, and more strategic control over your predictive analysis.
By leveraging these methods, you can enhance forecast accuracy, explore complex scenarios, and make data-driven decisions with confidence.
1. Custom Forecasting with DAX
- Tailored Calculations: With DAX (Data Analysis Expressions), you can create custom forecasting models that align with your unique business requirements. This flexibility allows you to refine predictions beyond Power BI’s built-in tools. An experienced Power BI development partner can design and implement these tailored solutions, ensuring accuracy and scalability.
- Time Intelligence Functions: DAX provides powerful time-based calculations that enable dynamic forecasting, making it easier to analyze trends over time and adjust projections as needed.
2. Enhancing Forecasts with Python and R
- Advanced Statistical Models: Power BI supports Python and R script integration, unlocking sophisticated forecasting methods, including machine learning algorithms and time-series analysis for more complex predictions.
- Custom Data Visualizations: Beyond just numbers, Python and R can generate rich, interactive visualizations that provide deeper insights into your forecasted data, improving interpretation and decision-making.
3. AI-Driven Forecasting with Machine Learning
- Azure Machine Learning Integration: Seamlessly bring in advanced forecasting models developed in Azure ML, enabling more precise predictive analytics within your Power BI reports.
- Automated Machine Learning (AutoML): If you use Power BI Premium or a dedicated Pro capacity, you can leverage AutoML to generate and refine machine learning models automatically, making advanced analytics accessible without extensive coding.
4. Scenario Analysis for Smarter Planning
- What-If Analysis: Power BI’s what-if parameters allow you to simulate different scenarios by adjusting key variables, helping you test assumptions and explore the impact of different business conditions on your forecasts.
5. Continuous Improvement with Iterative Refinement
- Adaptive Learning: Forecasting isn’t a one-time process. Regularly refining your models based on new data helps improve accuracy over time.
- Real-World Feedback: Compare predicted vs. actual results and incorporate insights from real-world performance to fine-tune your forecasting approach, ensuring continued relevance.
Best Practices for Forecasting With Power BI
To get the most reliable and actionable insights from forecasting in Power BI, it’s essential to follow certain best practices. These practices can help you improve accuracy, minimize errors and ensure your predictions drive smarter decision-making.
1. Ensure High-Quality Data
- Clean and Complete Data: The accuracy of your forecast depends on the quality of your input data. Remove outliers, fill in missing values, and ensure consistency before running forecasts.
- Optimal Granularity: Striking the right balance in data granularity is key—too detailed can introduce noise, while overly aggregated data may hide important trends.
2. Choose the Right Time Frame
- Leverage Historical Data: Use a sufficient amount of past data to capture meaningful trends, but avoid including irrelevant or outdated data that could distort predictions.
- Set a Realistic Forecast Horizon: Shorter forecasts tend to be more reliable, as long-term predictions introduce greater uncertainty due to unpredictable market changes.
3. Factor in Seasonality and Trends
- Identify Recurring Patterns: If your data shows seasonal trends (e.g., monthly or yearly cycles), ensure your forecasting model accounts for them to prevent skewed results.
- Detect Long-Term Trends: Understand whether your data follows upward or downward trends and adjust forecast settings accordingly.
4. Optimize Forecast Parameters
- Customize Confidence Levels: Adjust confidence intervals to match the level of uncertainty in your data, ensuring your forecast reflects realistic expectations.
- Fine-Tune Seasonality Settings: If Power BI doesn’t automatically detect seasonality correctly, manually set the appropriate intervals based on your business data.
5. Validate and Cross-Check Forecasts
- Compare Predictions with Actuals: Regularly validate your forecast against real-world results and refine your models as needed.
- Use Multiple Data Sources: Don’t rely solely on forecasts—combine them with other analytics and business insights for a well-rounded decision-making process.
6. Communicate Forecast Assumptions Clearly
- Be Transparent: When sharing forecasts with stakeholders, clearly outline assumptions, confidence levels, and limitations to manage expectations.
- Provide Context: Visualize forecasts with annotations and insights to help others understand the reasoning behind the numbers.
7. Continuously Improve Your Forecasting Approach
- Stay Up to Date: Power BI frequently introduces new forecasting capabilities—keep learning and exploring updates to enhance your predictive analysis.
- Refine Over Time: Forecasting is an iterative process. Regularly update your models based on new data and evolving market conditions to maintain accuracy.
Limitations of Forecasting in Power BI
While Power BI provides powerful forecasting capabilities, it’s important to be aware of its limitations to ensure accurate and reliable predictions when forecasting with Power BI. Here are some key limitations to consider:
1. Dependence on Historical Data
- Requirement for Historical Data: Power BI relies heavily on historical data to generate forecasts. Without sufficient past data, the model cannot identify trends or make accurate predictions.
- Quality of Data: The accuracy of the forecast is directly tied to the quality of the historical data. Incomplete, inaccurate, or inconsistent data can lead to unreliable forecasts.
2. Limited Forecast Length
- Short-Term Accuracy: Forecasts are generally more accurate over shorter time frames. As the forecast period extends, the reliability decreases due to the increasing uncertainty and potential for unforeseen factors.
- Long-Term Forecasting: For long-term predictions, the model may fail to account for significant changes in trends, external factors, or market conditions that could impact future values.
3. Handling of Seasonality and Trends
- Seasonality Detection: While Power BI can automatically detect and incorporate seasonality, it may not always accurately identify complex seasonal patterns, especially if the data contains multiple overlapping seasonal cycles.
- Changing Trends: The forecasting model assumes that past trends will continue into the future. Sudden changes in trends, whether due to market shifts, economic changes, or other factors, are not easily accounted for.
4. Assumptions of Continuity
- Constant Patterns: The forecasting algorithms in Power BI assume that patterns in the historical data will persist. This assumption may not hold true in dynamic environments where significant changes occur.
- Event Impact: Unexpected events or outliers (e.g., economic downturns, natural disasters) are not predicted by the model, which can significantly impact the accuracy of the forecast.
5. Limited Customization
- Algorithm Customization: Users have limited control over the underlying forecasting algorithms. While Power BI offers some customization options, advanced users might find the lack of detailed control over the model’s parameters restrictive.
- Complex Scenarios: For complex forecasting scenarios requiring sophisticated modeling techniques (e.g., ARIMA, machine learning-based methods), Power BI’s built-in forecasting may be insufficient.
Mitigating Limitations
To mitigate these limitations, users can:
- Combine Tools: Use Power BI in conjunction with other statistical or forecasting tools (e.g., R, Python) for more advanced modeling.
- Data Quality: Ensure high data quality by cleaning and validating historical data before generating forecasts.
- Regular Updates: Continuously update forecasts with new data and validate against actual outcomes to refine and improve the model.
- Customization: Explore advanced customization options and potentially integrate custom forecasting algorithms using Power BI’s integration capabilities.
By understanding these limitations and taking proactive steps to address them, users can maximize the effectiveness of forecasting in Power BI and make more informed, data-driven decisions.
Frequently Asked Questions (FAQs)
Q: Can Power BI do predictions?
Yes, Power BI can make predictions using built-in forecasting tools. It analyzes historical data, detects trends, and projects future values, helping businesses make data-driven decisions with confidence.
Q: What types of data are suitable for forecasting in Power BI?
Time series data, which includes data points collected or recorded at consistent time intervals, is suitable for forecasting. Examples include daily sales figures, monthly revenue, annual temperature readings, and other metrics that show trends over time.
Q: How far into the future can Power BI forecast accurately?
The accuracy of a forecast in Power BI diminishes as you project further into the future. Generally, forecasts are more reliable for shorter time frames, such as a few weeks to a few months, depending on the volatility and seasonality of the data. It is important to validate and regularly update forecasts with new data to maintain accuracy.
Q: Can Power BI forecast without historical data?
No, Power BI forecasting relies on historical data to identify patterns and trends that can be projected into the future. Without historical data, it is impossible to perform a forecast as there is no baseline to analyze and predict future values.
Q: Can I integrate forecast visualizations into my Power BI reports and dashboards?
Yes, you can integrate forecast visualizations into your Power BI reports and dashboards. This allows for real-time monitoring and sharing with stakeholders. You can combine forecast visualizations with other relevant data insights to provide a comprehensive view.

Related Blogs

Data Warehouse Cost Breakdown: Factors, Pricing Models & Platform Comparison
Discover how much a data warehouse costs in 2025. Explore pricing models, key factors, and platform comparisons to plan your data budget effectively.
Tarsem Singh
Nov 6 ,
14 min read

How Much Do Integrations Cost? [Pricing Breakdown & Key Insights]
Learn how much integrations cost, key factors influencing pricing, hidden expenses to avoid, and effective ways to reduce integration costs.
Tarsem Singh
Nov 6 ,
9 min read
Power BI for Inventory Management: A Comprehensive Guide
Explore the hidden power of Power BI for inventory management and how it provides businesses with powerful analytics and visualization capabilities.
Tarsem Singh
Oct 8 ,
19 min read