

Power BI vs Tableau: Which is the Better BI Tool?
Tarsem Singh | May 26, 2024 , 11 min read
Table Of Content
When it comes to Business Intelligence (BI) and data visualization, Power BI and Tableau are two of the biggest names in the industry. While both are similar products, there some still some key difference between them.
Power BI is known for its strong integration with Microsoft products, while Tableau has a reputation for being more user-friendly.
Additionally, Tableau offers more advanced analytics capabilities, while Power BI provides better collaboration features. Ultimately, the choice between these two industry leaders will depend on your specific requirements and business needs.
What is Power BI?
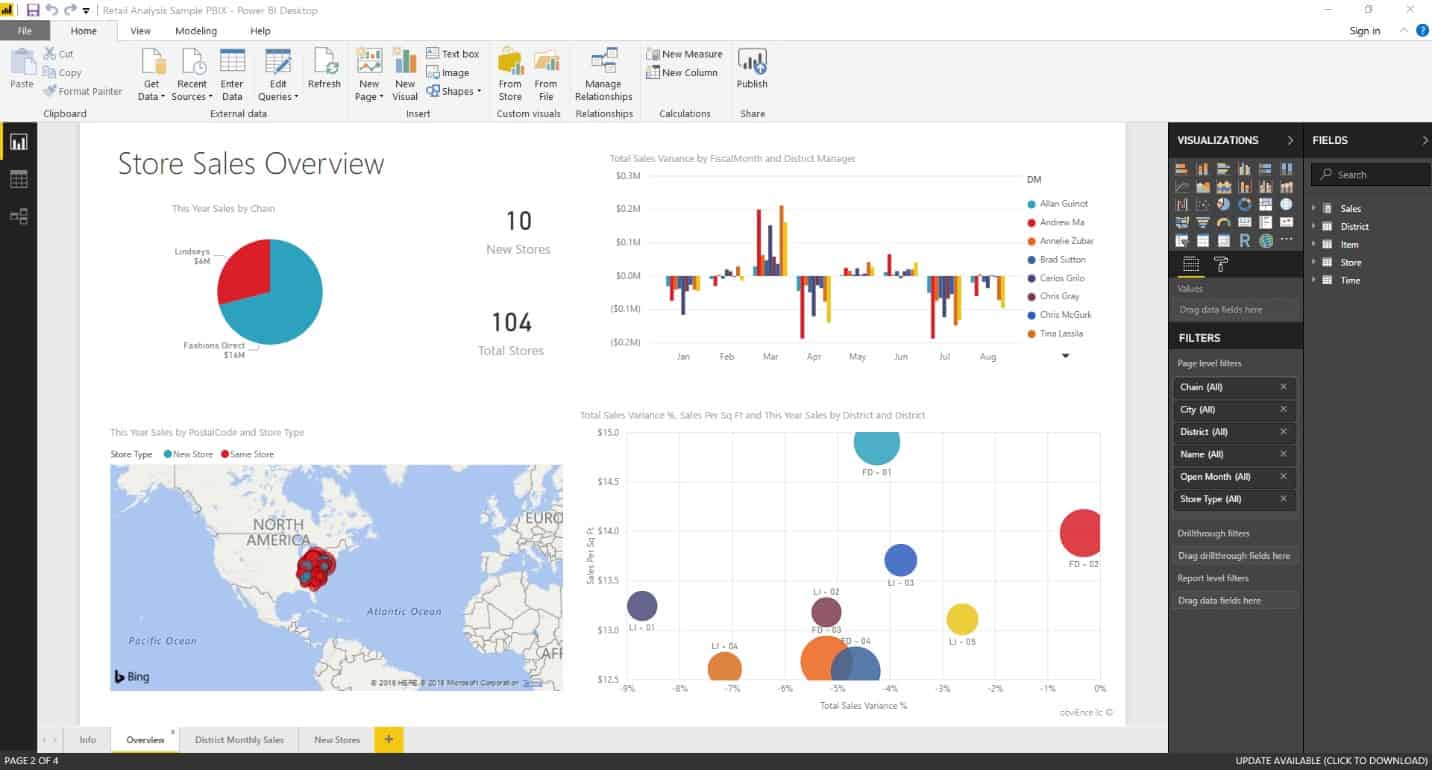
Power BI is a suite of analytics and data visualization tools offered by Microsoft for BI. It is also a BI platform that offers a full overview of an organization’s most critical data. Power BI provides both cloud-based and desktop-based interfaces.
Power BI connects to all their data sources and provides scalable dashboards by simplifying data sharing and evaluation. The key differentiator of this product is its: easy-to-navigate dashboards, self-service interactive reports, and compelling high-quality visuals. Power BI has three versions: Desktop, Pro, and Premium.
Also Read: Power BI License Types: A Clear Breakdown of Options
What is Tableau?
Tableau is a data visualization software application primarily used for data science and BI. The software can create a wide range of visualizations to interactively present the data and showcase insights.
It also comes with real-time data analytics capabilities, cloud support, and the option to embed dashboards into existing business applications.
Tableau has been the gold standard in data visualization for a long time and has mapping functionality. But Power BI is its biggest competitor at present.
The various versions of Tableau are Tableau Desktop, Server, Online, Reader, and Public. Tableau allows users to ask “what if” queries through which you can adjust data hypothetically and visualize data components.

Features of Power BI
Power BI is a powerful analytics and data visualization tool that offers several features to help businesses gain insights from their data. Some of the key features of Power BI include:
- Data visualization: Power BI offers a variety of pre-built visualizations to help businesses create interactive and compelling reports and dashboards. It includes various charts, graphs, maps, and other visualizations that can be customized based on specific requirements.
- Data exploration: With Power BI, users can easily explore their data to find insights and trends. They can drill down into their data to see the underlying details, making it easier to identify patterns and outliers.
- Data modeling: Power BI offers a robust data modeling engine that allows businesses to create complex data models to support their reporting and analysis needs. It includes features like calculated columns, measures, and relationships, enabling users to create sophisticated data models.
Features of Tableau
Tableau is a powerful data visualization software application that offers a wide range of features to help businesses gain insights from their data. Some of the key features of Tableau include:
- Data visualization:Tableau offers a wide range of pre-built visualizations to help businesses create interactive and compelling reports and dashboards. It includes various charts, graphs, maps, and other visualizations that can be customized based on specific requirements. Tableau also offers advanced visualizations such as heat maps, tree maps, and scatter plots.
- Data exploration:With Tableau, users can easily explore their data to find insights and trends. They can drill down into their data to see the underlying details, making it easier to identify patterns and outliers. Tableau also offers the ability to create dynamic sets, which allow users to define a subset of data based on specific criteria.
- Real-time data analytics:Tableau offers real-time analytics capabilities, allowing users to connect to live data sources, analyze data in real-time, and create dashboards that update automatically. This feature is particularly useful for businesses that need to monitor their data in real-time, such as those in the finance or healthcare industries.
Advantages & Disadvantages of Power BI
Some advantages and disadvantages of Power BI include:
| Advantages | Disadvantages |
| User-friendly interface | A steeper learning curve for complex analyses |
| Seamless integration with various data sources | Costly for large-scale deployments |
| Powerful data modeling capabilities | Limited customization options compared to competitors |
| Real-time data visualization | Requires a good understanding of data structures |
| Scalable for small to large businesses | Dependency on stable internet connectivity |
| Wide range of visualization options | Data privacy concerns due to cloud-based storage |
Advantages & Disadvantages of Tableau
Below are some advantages and disadvantages of Tableau
| Advantages | Disadvantages |
| Intuitive and user-friendly interface | Steeper learning curve for advanced features |
| Powerful and interactive data visualization | Costly for individual and enterprise licenses |
| Seamless integration with various data sources | Requires some knowledge of data preparation |
| Robust community support and resources | Limited customization options for certain visuals |
| Scalable for small to large businesses | Can be resource-intensive for large datasets |
| Real-time data analysis and dashboard updates | Exporting visualizations may require additional tools |
Key Differences Between Power BI and Tavleau
The following are the key differentiators between Tableau and Power BI:
- Pricing: Tableau is more expensive than Power BI for larger enterprises. The desktop version of Power BI is free to use. Power BI is cost-efficient. The Pro version of the Power BI cloud costs less than US$ 10 per month (cheapest in the market) whereas the Pro version of Tableau is over US$ 35 per month. This is over thrice the cost of Power BI. It is better to start off with Power BI and upgrade to Tableau when the need arises. If you are a Small and Medium Enterprise (SME) and do not know which tool to choose, Power BI is a better option for you.
- API Integration: Power BI presents an Application Programming Interface (API), where advanced users can create their own visualization types. They can then integrate within Power BI’s toolbox, as Microsoft has provided them with the base package. Power BI has an edge over Tableau given the data source connectivity of Microsoft’s API and web services expertise on Azure Cloud. Microsoft’s Power BI Azure support is faster than Tableau’s cloud BI support.
- User Interface: Tableau has a slicker user interface while Power BI has a more intuitive interface. Power BI is easier to learn than tableau because of its simplicity and ease to use.
- Easy Integration with other Microsoft products: Being a Microsoft Tool, Power BI fits perfectly into the Microsoft Ecosystem. Almost everyone in the world has an MS Office License and thus integrating Power BI with other MS Office products is easy. Power BI and Excel provides six additional integration points. It is a better option if you need quick access to specific analytics or intensive reporting (and have personnel who are skilled in MS-based data queries).
- Connecting to other data sources: Power BI easily connects with sources such as-
- Microsoft Dynamics
- Salesforce
- Google Analytics
- Microsoft Excel and many more.
This easy integration is not possible with Tableau.
- Suitability and Users: Power BI is more suitable for creating and displaying basic dashboards and reports. Hence Power BI can be used by anybody and learned easily. Power BI has more expertise with predictive modeling, reporting, and optimization when some broad back-end analytics is needed. Power BI makes a correlation between data sets. Tableau is more suitable for analysts, as it offers in-depth front-end analysis.
- Simple and clean visualization: Power BI focuses on data manipulation and then provides simple visuals whereas Tableau simply focuses on visuals. With Power BI, users can choose from many visualizations as blueprints and then insert data from a sidebar into the visualization. The Cortana virtual personal digital assistant in Power BI lets users create visuals by asking queries with natural language. Power BI has a readymade visuals gallery filled with useful visuals created by Microsoft and the Power BI community. You can download these visuals and use them in your Power BI reports.
- Pre-defined templates: Power BI comes with ready-made templates for Marketing, HR, and Operations tools.
- Product Support: Power BI has Phone, Ticket, and Training as Product support features whereas Tableau has only Phone and Training support.
| Category | Power BI | Tableau |
| Pricing | The pro version of the cloud costs less than US$ 10 per month (the cheapest in the market). | The pro version of the cloud is over US$ 35 per month (over thrice the cost of Power BI) |
| API Integration | Presents an Application Programming Interface (API) for creating custom visualizations | Lacks the same level of API flexibility as Power BI |
| User Interface | Easier to learn due to simplicity and ease of use | Offers a more advanced interface that may require a steeper learning curve |
| Integration with MS | Fits perfectly into the Microsoft Ecosystem | Offers integration with Microsoft products but may not be as seamless as Power BI |
| Data Source Connectivity | Easily connects with various sources including Microsoft Dynamics, Salesforce, Google Analytics | Offers connectivity to a wide range of data sources but may require additional setup |
| Sustainability and Users | More suitable for basic dashboards and reports | More suitable for in-depth front-end analysis |
| Simple and Clean | Focuses on data manipulation and provides simple visuals | Focuses on providing highly customizable and visually appealing visualizations |
| Visualization | Users can choose from many visualizations as blueprints and insert data from a sidebar | Offers a wide range of visualization options, including complex and interactive visuals |
| Pre-defined Templates | Comes with ready-made templates for Marketing, HR, and Operations tools | Offers pre-defined templates for various industries and use cases |
| Product Support | Phone, Ticket, and Training support features | Offers Phone and Training support but may lack ticketing support |
Also read: Power Bi vs Excel: Which tool is right for your business?
How can ScaleupAlly help you?
ScaleupAlly, as a company can deploy Power BI in your organization and can create BI on a periodic basis. Our data management services can help you leverage data with Power BI and make data-driven decisions. We offer the following Power BI services:
- BI strategy and Roadmap development
- Data quality assessment and integration
- Data warehouse and visualization
- Implementation services
Conclusion
When it comes to comparing Power BI vs Tableau, many users wonder if Tableau is better or Power BI. Both are powerful BI tools with unique capabilities. While Power BI is more affordable, easier to use, and integrates seamlessly with the Microsoft ecosystem, Tableau offers more advanced visualization options and real-time analytics.
So, if you’re trying to decide between the two, it’s important to evaluate your requirements carefully and determine which tool would best fit your business needs.
However, if you’re considering implementing Power BI, ScaleupAlly can provide expert services to help you leverage your data and make informed decisions. Feel free to contact us for assistance.
Frequently Asked Questions
Q: Can Power BI and Tableau connect to different data sources?
Yes, both Power BI and Tableau can connect to various data sources, including Excel, SQL Server, and cloud services like Google Analytics and Salesforce.
Q: Which tool is more suitable for large-scale enterprises?
Both Power BI and Tableau are suitable for large-scale enterprises. However, Power BI is often preferred by organizations already using Microsoft products due to its seamless integration with the Microsoft ecosystem.
Q: Does Power BI or Tableau offer better collaboration features?
Power BI and Tableau offer collaboration features allowing users to share reports and dashboards with others. However, Tableau is often praised for its more robust collaboration capabilities.
Q: Which tool offers better customer support?
Power BI and Tableau offer customer support options, including documentation, community forums, and paid support plans. However, Tableau is often considered to have more comprehensive customer support.
Q: Is there a clear winner between Power BI vs Tableau?
Power BI and Tableau ultimately depend on your specific needs and requirements. Both tools offer powerful data visualization and analysis features, so it’s essential to evaluate them based on your organization’s needs.
Similar Comparison Articles Around Power BI

Related Blogs

Power BI Cost: Comprehensive Guide to Pricing Plans
Compare different types of Power BI Licenses and their costs: Free, Pro, and Premium options explained. Discover which Power BI plan suits your business needs.
Tarsem Singh
Jun 30 ,
12 min read

Power BI Consultant Hourly Rates: How Much Does It Cost?
Struggling to understand the cost of hiring a Power BI consultant? Find out the Power BI consultant hourly rates, what factors influence the price and how to find the best value for your business.
Pranay Agrawal
Jun 30 ,
15 min read

Power BI Implementation: A Step-by-Step Guide for Businesses
Discover how to implement Power BI in your organization with this comprehensive guide. Learn essential steps and best practices for successful implementation.
Tarsem Singh
Jun 30 ,
12 min read
Our Promise
Let’s build something extraordinary together.