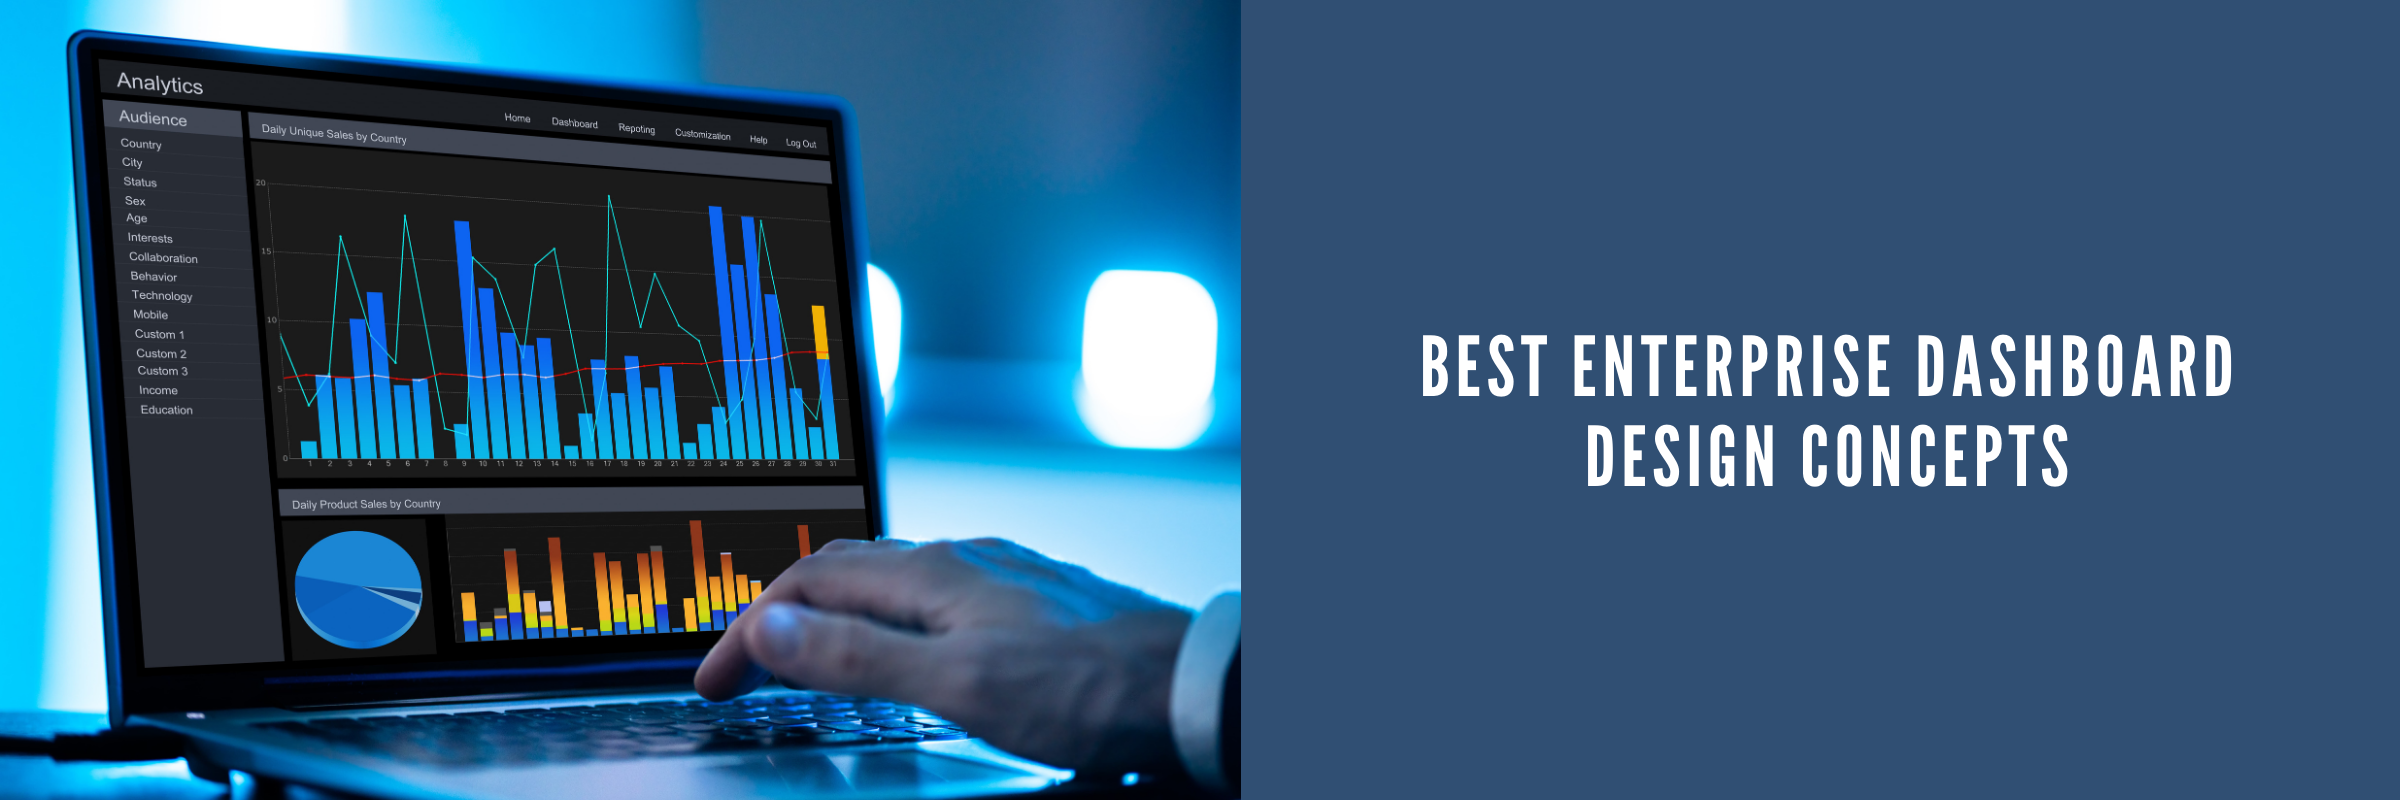
Best Enterprise Dashboard Design Concepts
Tarsem Singh | August 29, 2024 , 8 min read
Table Of Content
Understanding and analyzing data quickly is crucial for business success. Enterprise Dashboard Design plays a key role in modern business strategy by visually presenting complex data in a way that helps decision-makers.
In today’s information-rich world, a well-designed dashboard can turn raw data into useful insights, improving how a business operates and makes decisions. Understanding business dashboard design can be challenging, especially for those unfamiliar with the technical details.
This article explores the details of enterprise dashboard design and its best practices by looking at concepts that can change how organizations understand and use their data.
Key Takeaways
- Enterprise dashboards serve as a centralized interface, consolidating KPIs and metrics into clear, visual insights for decision-makers.
- By aggregating data from multiple sources, dashboards simplify complexity, making performance tracking and analysis more efficient.
- Real-time monitoring empowers leaders to adapt strategies quickly, enhancing operational efficiency and aligning with organizational goals.
- Well-designed dashboards improve decision-making by transforming raw data into actionable intelligence that is easy to interpret.
- Clear visualization of key performance indicators ensures stakeholders stay informed, aligned, and focused on long-term business growth.
What is the Enterprise Dashboard?
Enterprise Dashboard is a centralized digital interface showing a comprehensive overview of an organization’s key performance indicators (KPIs) and metrics. It aggregates data from different sources to present them visually, using graphs, charts, and tables.
Its purpose is to enable executives and managers to monitor business performance, identify trends, and make data-driven decisions.
Viewing the different business insights together in real-time, like customer engagement, finance, and operations, helps in improving strategic planning. In turn, it improves operational efficiency, ensuring stakeholders stay aligned with and informed about organizational goals.
The Significance of Dashboard Design
A dashboard shows important information all in one place, making it easier to understand key performance indicators (KPIs). It helps businesses and organizations make smart choices by navigating through lots of data.
1. Clarity in Complexity
Clear communication is crucial when dealing with complex information. Well-designed dashboards simplify complicated data, making it easy to understand quickly, even when dealing with intricate datasets.
2. Time-Efficient Decision-Making
Time is crucial in business. Well-designed dashboards speed up decision-making by showing important information in an easy-to-understand way.
3. Strategic Vision
Dashboards provide a comprehensive overview of how well an organization is performing. This helps entrepreneurs adjust their strategies based on up-to-date information about market trends and insights.
Best Enterprise Dashboard Design Concepts
Let’s explore important concepts that make up excellent Enterprise Dashboard Design, combining style and usability to create a user experience that can make a big difference.
1. Intuitive Information Architecture
The key to a good dashboard is its easy-to-follow layout. This means arranging information in a way that makes sense to the user, so they can quickly understand it. Business people shouldn’t have to work hard to understand the data; it should be clear and easy to grasp.
Implementation Tips:
- Group related metrics logically.
- Prioritize information based on its importance.
- Follow a logical flow for effortless comprehension.
2. Data Visualization Mastery
Data visualization is like the language of dashboards. Picking the best charts, graphs, and visuals is a skill. It’s about showing complicated data in a way that makes sense to the user. For people in business, this means changing raw numbers into useful ideas.
Effective Strategies:
- Select the right visualization for each data type.
- Ensure clarity, avoiding unnecessary embellishments.
- Leverage color coding for quick interpretation.
3. Interactivity for Engagement
A dashboard with only static information is limited in what it can do. Adding interactive features, like filters and clickable parts, becomes a dynamic tool. These features give users more control and make it easier to explore data in detail, which keeps them interested and helps them understand the information better.
Strategic Approaches:
- Implement filters for periods, regions, or specific metrics.
- Allow users to click for more detailed information.
- Provide tooltips for additional context.
4. Responsive Design for Accessibility
Designs need to be responsive because people use different devices to access information. A dashboard should adjust smoothly to different screen sizes so users can easily use it on their phones or tablets. For startup founders, this means they can access important information wherever they are.
Key Considerations:
- Prioritize essential information for smaller screens.
- Test functionality across various devices.
- Incorporate touch-friendly elements for mobile users.
5. Real-Time Data Updates
Being timely gives you an edge. Real-time dashboards make sure decision-makers have the newest info. This quickness can make a big difference for startup founders in fast-changing markets.
Best Practices:
- Integrate data sources with real-time feeds.
- Indicate the freshness of displayed data.
- Allow users to toggle between real-time and historical views.
6. Adherence to Branding Guidelines
When starting a business, it’s crucial to be consistent in how you present your brand. The dashboards you create should follow your brand’s visual guidelines closely, ensuring your brand looks the same across different platforms and uses.
Key Elements:
- Use company colors, fonts, and logos consistently.
- Customize dashboard themes to match brand aesthetics.
- Ensure a seamless transition from other business applications.
In the next sections, we’ll explore real-world examples of organizations that have successfully implemented these concepts, providing insights into their practical application.
5 Examples of Well-Designed Enterprise Dashboards
Let’s explore real-world examples of organizations that have embraced innovative dashboard design concepts to elevate their data interpretation.
1. Airtel
Airtel, a top telecommunications company in India, aims to offer a full suite of cloud communication services for businesses to enhance customer engagement across various channels. Their call logs dashboard gives a detailed summary of important information. The main goal is to help users quickly grasp customer details and gather useful insights. The screen below allows users to switch between customers, interactions, and issues without disrupting the logical flow.

Image source: Onething
2. Google Analytics
Google Analytics features a simple and uncluttered dashboard layout designed to prioritize showing key information in a user-friendly way. It includes interactive charts and graphs that enable users to explore specific details. This dashboard allows users to smoothly transition between customers, charts, and graphs without disrupting the logical flow or consistency.

Image source: Aroged
3. Hubspot
HubSpot has a unique dashboard design using cards that make it easy to move around the platform. It includes interactive charts and graphs for real-time data analysis. The new dashboard is more engaging, easier to navigate, and helps users find information quickly, creating a smooth user experience.

Image source: Hubspot
4. TextMagic
TextMagic’s dashboard is designed to be sleek and user-friendly, prioritizing ease of use. Its clean, minimalistic design ensures users can access key information without feeling overwhelmed. Interactive charts and graphs simplify data analysis, while straightforward navigation allows seamless movement between different platform parts.

Image Source: Dribbble
5. Trello
Trello’s dashboard is designed to help you manage tasks and deadlines effortlessly. Based on cards, its layout allows you to organize and monitor tasks quickly. Interactive charts and graphs help you track progress easily. Plus, its sleek dark mode makes it usable in low-light settings. Overall, this showcases Trello’s skill in engaging users by simplifying the “to-do list” and giving it a distinct personality that sets it apart from similar tools.

Image Source: Trello
Conclusion
From intuitive information architecture to responsive design, the success stories of these organizations demonstrate that thoughtful implementation of dashboard design concepts can catalyze positive organizational transformation. A well-designed dashboard should be easy to use, present information innovatively, and help users grasp the data quickly.
To speak to our BI experts, talk to us today!
Frequently Asked Questions
Q: Why is data visualization important in Enterprise Dashboard Design?
Data visualization is how data is communicated visually through charts, graphs, and other graphical elements. It is essential because it transforms raw data into an easily understandable format, facilitating quicker comprehension and decision-making.
Q: Why are real-time data updates important in dashboard design?
Real-time data updates provide users with the most current information, allowing for timely decision-making. This is particularly valuable in dynamic business environments where staying informed about changes as they happen is crucial.
Q: Can Enterprise Dashboard Design concepts be applied to any industry?
Yes, effective Enterprise Dashboard Design principles are adaptable to various industries. Whether it’s finance, healthcare, e-commerce, or technology, the key concepts remain relevant in creating dashboards tailored to specific industry needs.
Q: How can organizations measure the effectiveness of their dashboard designs?
The effectiveness of dashboard designs can be measured through user feedback, key performance indicators (KPIs), and the impact on decision-making processes. Regular assessments and updates based on user needs and technological advancements contribute to ongoing improvement.
Related Blogs

Data Warehouse Cost Breakdown: Factors, Pricing Models & Platform Comparison
Discover how much a data warehouse costs in 2025. Explore pricing models, key factors, and platform comparisons to plan your data budget effectively.
Tarsem Singh
Nov 6 ,
14 min read

How Much Do Integrations Cost? [Pricing Breakdown & Key Insights]
Learn how much integrations cost, key factors influencing pricing, hidden expenses to avoid, and effective ways to reduce integration costs.
Tarsem Singh
Nov 6 ,
9 min read
Power BI for Inventory Management: A Comprehensive Guide
Explore the hidden power of Power BI for inventory management and how it provides businesses with powerful analytics and visualization capabilities.
Tarsem Singh
Oct 8 ,
19 min read
