
Complete Guide on How Data Analytics Helps in Digital Marketing
Tarsem Singh | November 29, 2023 , 12 min read
Table Of Content
Did you know? In the time it takes to read this sentence, approximately 3.8 million Google searches are conducted worldwide. That’s the staggering speed at which data swirls and twirls in our digital cosmos, shaping the very essence of modern marketing.
Welcome to the frontier where bytes, insights, and strategies collide in a whirlwind of digital brilliance! In today’s fast-paced digital landscape, data analytics isn’t just a tool—it’s the guiding North Star that illuminates the path to marketing success. Imagine peeking into the minds of your audience, unravelling the mysteries of campaign effectiveness, and crafting strategies with the precision of a master craftsman.
That’s the mesmerizing journey we’re embarking on—the extraordinary world of data-driven marketing.
Ready for an adventure? Let’s explore the riveting landscapes of data analytics in the realm of digital marketing!
What is Data Analytics?
Data analytics is the process of interpreting raw data to uncover insights and trends, employing statistical techniques for informed decision-making. It involves cleaning, organizing, and exploring data, and presenting findings with visualization tools. Businesses use analytics to gain a competitive edge, improve efficiency, and predict trends. This process involves a series of essential steps:
- Interpreting Raw Data: Data analytics begins by interpreting raw data, employing statistical methods to extract meaningful insights.
- Cleaning and Organizing: Before analysis, data is meticulously cleaned and organized to ensure accuracy and relevance.
- Exploration and Visualization: The data is explored to identify trends and correlations, presented vividly using visualization tools like graphs and charts.
- Decision-Making and Efficiency: Businesses leverage analytics to enhance efficiency, predict trends, and gain a competitive edge in their respective industries.
Key tools that play a pivotal role in this landscape:
- Excel and MS Access: These tools aid in organizing and managing data effectively.
- SQL: Crucial for querying databases, SQL extracts specific information required for analysis.
- Power BI: Empowers dynamic exploration and visualization, facilitating advanced analytics and reporting.
Importance of data analytics in Digital Marketing
“Without data analytics, companies are blind and deaf, wandering out onto the web like a deer on a freeway.” – Geoffrey Moore (American Management Consultant and author)
In the dynamic sphere of digital marketing, data analytics stands as a linchpin for marketing managers. Its pivotal role lies in deciphering the wealth of available data, enabling profound insights and informed decision-making. By delving into essential metrics such as website traffic and conversion rates, managers gain a deep understanding of consumer interactions with their campaigns. Here are key points illuminating its significance:
- Insight Generation: Data analytics empowers marketers to derive actionable insights from complex datasets, allowing them to grasp consumer behavior patterns and campaign effectiveness.
- Visual Data Interpretation: Tools like POWER BI and Tableau are instrumental in transforming intricate data into visually digestible formats, facilitating trend identification and informed decision-making.
- Real-Time Visualization: Particularly crucial for time-sensitive campaigns, real-time data visualization empowers swift decision-making, enabling managers to make prompt adjustments based on emerging trends or insights.
- Predictive Analytics and ROI Measurement: Predictive analytics adds a personalized touch to marketing endeavors, while measuring Return on Investment (ROI) becomes pivotal in attributing conversions to specific strategies, ensuring resource allocation optimization.
- Empowerment through Informed Decision-Making: Data analytics becomes the cornerstone for making informed decisions, optimizing campaigns dynamically, and showcasing tangible returns in the evolving digital landscape.
How Data Analytics is used in Digital Marketing?
To effectively implement data analytics in marketing strategies, marketing managers should follow a systematic approach.
Here are some key steps you can take:
1. Define Goals and Key Performance Indicators (KPIs)
Before diving into data analysis, it’s crucial to clearly define your marketing goals and identify the key performance indicators (KPIs) that align with those goals. Leveraging data analytics services can streamline the entire marketing strategy process, from defining goals to tracking KPIs and refining campaigns. Whether your objective is to increase website traffic, boost conversions, or improve customer retention, having well-defined goals and KPIs will guide your data analysis efforts and ensure that you are measuring the right metrics.
2. Collect and Cleanse Data
Data collection is a critical step in the data analytics process. Ensure that you have the necessary tools and systems in place to collect relevant data from various sources, such as website analytics, social media platforms, customer relationship management (CRM) systems, and marketing automation tools. It’s essential to ensure data accuracy and cleanliness by regularly cleansing and validating the data to eliminate duplicates, errors, and inconsistencies.
3. Analyze and Interpret Data
Once you have collected and cleansed the data, it’s time to analyze and interpret it to uncover meaningful insights. Utilize data visualization techniques, such as charts, graphs, and dashboards, to simplify complex data sets and make them more accessible. Look for patterns, trends, and correlations that can inform your marketing strategies and decision-making.
4. Test and Iterate
Data analytics is an iterative process. Test different marketing strategies, campaigns, and messaging to see what works best for your target audience. Use A/B testing and other experimental techniques to compare different variations and measure their impact on key metrics. Continuously monitor and analyze the results to refine your strategies and optimize your marketing efforts.
5. Embrace Continuous Learning
The field of data analytics is constantly evolving, with new tools, techniques, and trends emerging regularly. Stay updated with the latest advancements in data analytics and digital marketing to ensure that your strategies remain effective and competitive. Attend industry conferences, participate in online courses, and engage with industry thought leaders to broaden your knowledge and skills in data analytics.

Applications of Data Analytics in Digital Marketing
Data analytics plays a critical role in digital marketing. It involves the use of tools, technologies, and practices to collect, integrate, analyze, and present business information. Data analytics tools, such as Power BI, allow marketers to turn raw data into visually appealing dashboards, reports, and visualizations. These tools empower marketers to track key metrics, identify trends, and make data-driven decisions to optimize their marketing strategies
Let’s see some of the examples below:
1. Campaign Analysis:
Example: A marketing manager uses Excel to analyze campaign performance data exported from Google Analytics. They create pivot tables and charts to visualize metrics such as click-through rates, conversion rates, and revenue generated. This allows them to identify top-performing channels and optimize the marketing budget accordingly.
2. Customer Segmentation:
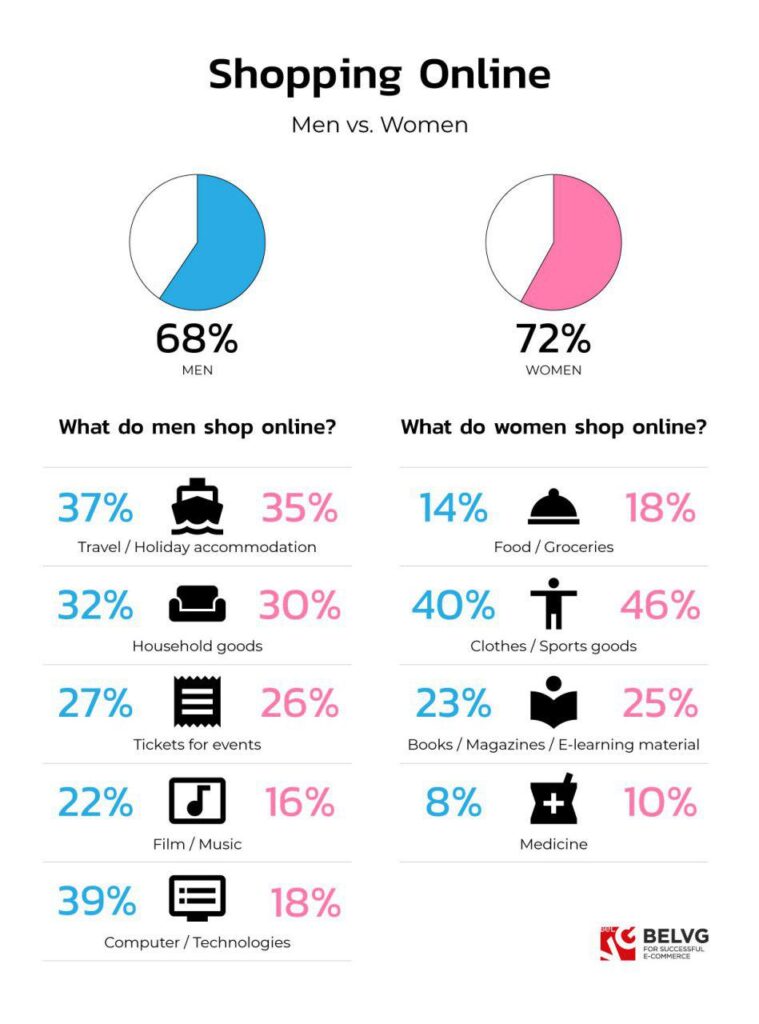
Example: A digital marketing analyst uses data to segment customers based on their purchase behavior. By analyzing the data or specific visuals, they identify high-value customers, enabling the marketing team to create targeted campaigns for this specific segment.
For example the pie chart below shows male vs female shopping pattern:
3. Dashboard for Social Media Analytics:
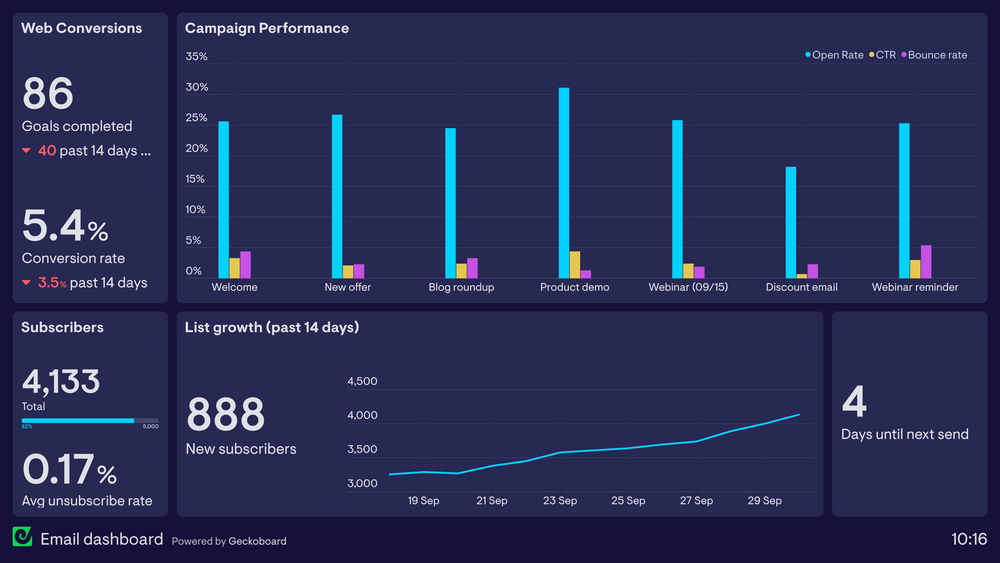
Example: A social media manager creates a Power BI dashboard that aggregates data from various platforms (Facebook, Twitter, Instagram). The dashboard includes charts displaying engagement metrics, follower growth, and popular content. This real-time visualization helps the team understand the impact of their social media efforts.
4. Ad-hoc Analysis in POWER BI for Ad Campaigns:
Application: An ad campaign manager uses POWER BI for ad-hoc analysis to investigate a sudden drop in click-through rates. They drag and drop relevant metrics to quickly create visualizations, identifying a specific demographic that is not responding well to the current ad creative. This prompts adjustments to the campaign targeting.
5. ROI Measurement:
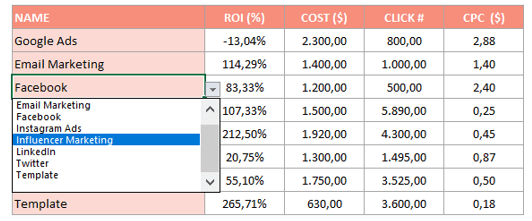
Application: A marketing analyst uses Excel to calculate the ROI of a recent email marketing campaign. They input data on campaign costs, attributed revenue, and other relevant metrics. Excel formulas help compute the ROI percentage, providing a clear measure of the campaign’s success.
6. A/B Testing Analysis:
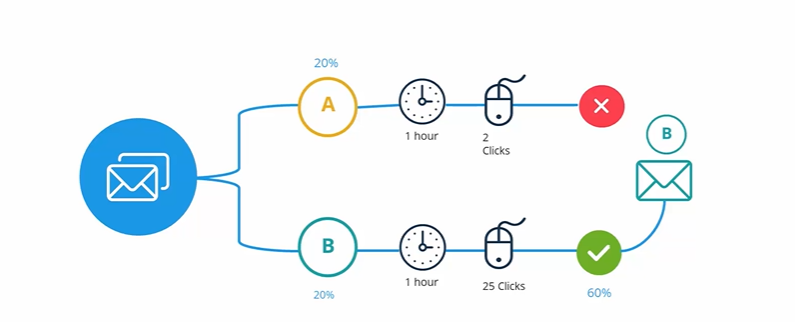
Application: A digital marketing team uses SQL queries to analyze A/B test results from a website. By querying the database, they compare conversion rates between the control and variant groups. SQL allows them to quickly retrieve and analyze the data to determine the statistical significance of the test.
7. Customer Cohort Analysis:
Application: Customer cohort analysis involves grouping customers based on common characteristics or behaviors. Data analytics helps organize and analyze customer data to create cohorts and track their behavior over time. Visualizations can depict how different cohorts engage with the brand, revealing insights such as retention rates, average order values, and lifetime value. This information guides personalized marketing strategies for each cohort.

Cohort analysis for members joined in the club and their spend pattern after joining.
8. Identifying Prime Audiences for Retargeting Campaigns:
Application: Data analytics assists in identifying prime audiences for retargeting campaigns by analyzing user behavior data. For example, an online retailer may use analytics tools to identify users who visited specific product pages but did not make a purchase. Visualizations can highlight the characteristics of this audience, helping marketers create targeted retargeting campaigns to re-engage and convert these potential customers.
9. Predicting Customer Lifetime Value or Propensity to Buy:
Application: Use of Predictive Analytics: Predictive analytics helps businesses predict how valuable a customer might be or the chance they’ll make a purchase. By looking at past customer data, we create models to foresee future behavior. Visualizations can show the factors affecting customer value or likelihood to buy, helping create focused marketing plans for different types of customers.
Real-life Examples of Data Analytics in Digital Marketing
Optimizing Operations for a Night Club
Tools Used: Power BI, Excel, SQL
Objective: A popular nightclub aims to optimize its operations, enhance customer experience, and maximize revenue through data analytics and visualization tools.
Attendance and Revenue Dashboard
- Power BI: The club creates a real-time dashboard displaying attendance and revenue metrics. Visualizations include a live attendance tracker, revenue trends, and key performance indicators (KPIs) like average spend per customer. This enables quick decision-making on staffing, promotions, and pricing strategies.
Customer Segmentation and Preferences
- Power BI and SQL: Utilizing SQL queries, the club integrates data from its membership database, social media interactions, and purchase history. Power BI visualizations segment customers based on demographics, preferences, and spending habits. This information guides targeted marketing campaigns and promotions for specific customer groups.
Ad-Hoc Analysis for Event Success
- Excel and SQL: Following a special event, the club conducts ad-hoc analysis using Excel and SQL. Analysis includes ticket sales, customer feedback, and social media engagement data. Excel’s pivot tables and charts provide insights into event success, helping identify trends and areas for improvement in future events.
Beverage Sales and Inventory Report in Excel
- Excel: The club uses Excel to create a detailed report on beverage sales and inventory. Visualizations depict top-selling drinks, inventory turnover rates, and trends in customer beverage preferences. This aids in optimizing inventory levels and refining the beverage menu.
Queue Management Dashboard in Power BI
- Power BI: A queue management dashboard in Power BI optimizes entry and wait times. Visualizations display real-time data on the number of people in the queue, entry rates, and historical wait times. This aids in resource allocation for efficient queue management and improved customer experience.
Member Retention Analysis
- Power BI and SQL: Power BI creates a member retention analysis dashboard by analyzing data on membership renewals, attendance patterns, and member engagement. Insights gained guide the development of targeted strategies to enhance member loyalty.
Staff Performance Dashboard in Power BI
- Power BI: A staff performance dashboard monitors the efficiency of bartenders, security personnel, and other staff members. Visualizations include service speed metrics, customer satisfaction ratings, and attendance-related KPIs. This helps in recognizing high-performing staff and identifying areas for improvement.
These applications illustrate how a nightclub can leverage data analytics, reports, and visualizations to enhance various aspects of its operations, from customer segmentation and event analysis to inventory management and staff performance monitoring.
Conclusion
In conclusion, data analytics is a game-changer in digital marketing. By harnessing the power of tools like Excel, Power BI, and SQL,MS Access, Tableau & many more such tools marketers can gain valuable insights, optimize strategies, and drive marketing success.
Whether it’s understanding the target audience, measuring campaign effectiveness, or applying data visualization techniques, data analytics empowers marketers to make informed decisions and achieve their marketing objectives. Embrace the power of data analytics and take your marketing strategies to new heights.
Frequently Asked Questions
Q: What are some common challenges in implementing data analytics in marketing strategies?
Implementing data analytics in marketing poses challenges in ensuring accurate data integration from diverse sources, such as social media and customer databases. Dealing with privacy regulations like GDPR and addressing a shortage of skilled data analysts adds complexity. Key considerations include investing in appropriate technology, fostering a data-driven culture within the team, and navigating the difficulties of understanding complex data and obtaining real-time insights. Continuous concerns involve measuring the effectiveness of marketing efforts and ensuring the security of data, making it akin to juggling multiple tasks simultaneously.
Q: How can I ensure data quality and accuracy in my analytics efforts?
To ensure data quality and accuracy in analytics efforts, establish clear data governance policies and standards, aligning metrics with business goals. Regularly assess data against these criteria, using validation processes to promptly rectify errors. Invest in robust data integration tools for streamlined information flow and minimized inconsistencies. Conduct regular audits to verify dataset accuracy and address discrepancies. Foster a culture of data responsibility, emphasizing its significance for informed decision-making, and stay updated on emerging technologies for continuous improvement.
Q: What are the best practices for data visualization in marketing analytics?
For effective marketing analytics, prioritize clear data visualization tailored to your audience. Choose appropriate chart types aligned with the data nature, keeping visuals simple for clarity. Strategically use colour to highlight key information, providing context through clear labels and titles. Ensure visualizations are responsive across devices, regularly updating and refining as data evolves. Encourage stakeholder feedback and leverage interactive elements for a more engaging and insightful experience.
Related Blogs

Data Warehouse Cost Breakdown: Factors, Pricing Models & Platform Comparison
Discover how much a data warehouse costs in 2025. Explore pricing models, key factors, and platform comparisons to plan your data budget effectively.
Tarsem Singh
Nov 6 ,
14 min read

How Much Do Integrations Cost? [Pricing Breakdown & Key Insights]
Learn how much integrations cost, key factors influencing pricing, hidden expenses to avoid, and effective ways to reduce integration costs.
Tarsem Singh
Nov 6 ,
9 min read
Power BI for Inventory Management: A Comprehensive Guide
Explore the hidden power of Power BI for inventory management and how it provides businesses with powerful analytics and visualization capabilities.
Tarsem Singh
Oct 8 ,
19 min read


