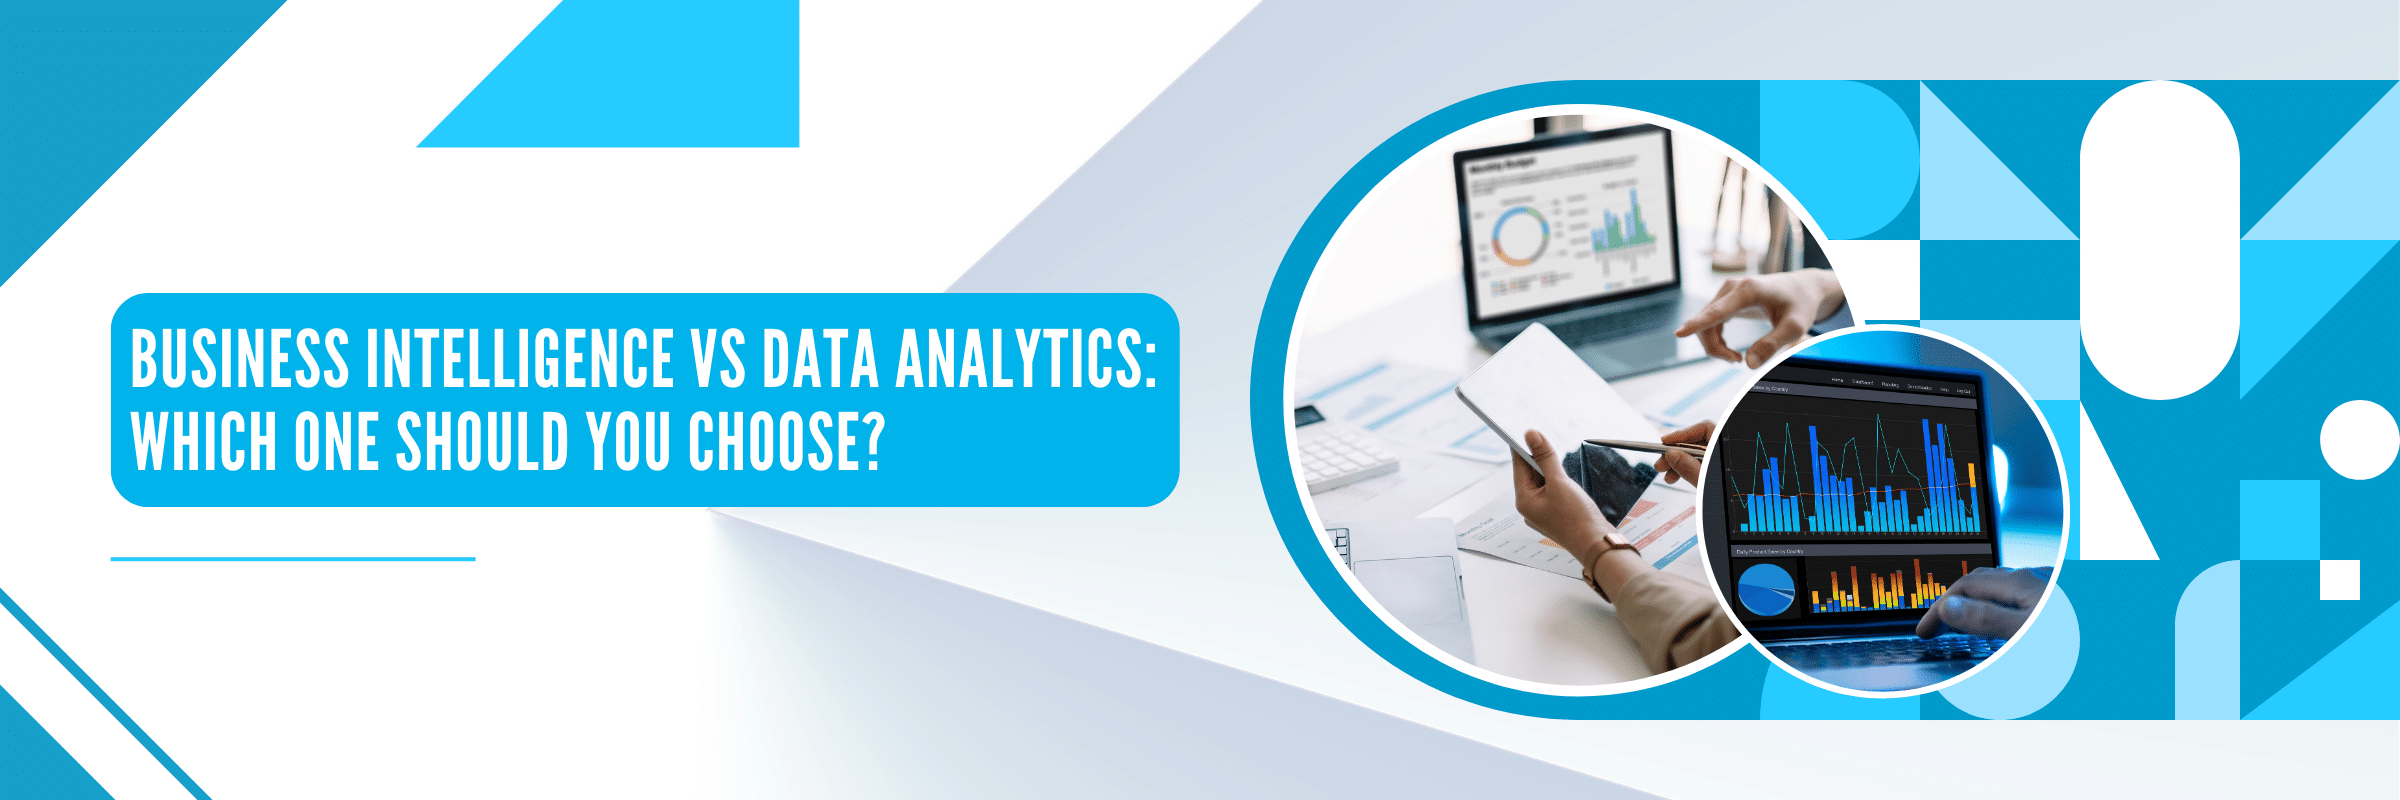
Business Intelligence vs Data Analytics: Which One Should You Choose?
Tarsem Singh | August 25, 2024 , 11 min read
Table Of Content
In an interview, Carly Fiorina, former president and chair of Hewlett-Packard Co., was asked about their company’s data analysis objectives. She responded, “The goal is to turn data into information and information into insight.”
Fiorina emphasized that data should be leveraged strategically to drive business decisions, a philosophy that proved successful for HP.
Raw data holds little value until it is processed and analyzed to generate actionable insights. Your business generates vast amounts of data daily, and effectively managing and utilizing this data can transform how you identify challenges and boost profitability.
Two essential methodologies can help you transform raw data into valuable insights: Business Intelligence (BI) and Data Analytics.
While these methodologies cater to different needs and user groups, both are designed to extract meaningful insights from data.
Understanding their differences is crucial in selecting the right one for your business needs. This blog will explore how each one of them functions and where it can be most effectively applied.
Key Takeaways
- Business Intelligence (BI) helps interpret historical and current data to support operational decisions, while Data Analytics (DA) uses advanced techniques to uncover deeper insights and predict future outcomes.
- BI is best suited for decision-makers who need quick, understandable insights, while DA often requires technical expertise and supports strategic, predictive planning.
- The two disciplines complement each other—BI highlights what has happened, and DA explains why it happened and what might happen next.
- Businesses don’t need to choose between BI and DA; combining both enables better day-to-day performance management and long-term strategic planning.
What is Business Intelligence?
Business intelligence is a part of data analysis that focuses on collecting, studying, and showing data in a way that’s easy to understand. The main goal of BI is to help businesses make better decisions by presenting data in a clear and actionable way.
Business Intelligence encompasses a range of software tools designed to streamline this process. These tools aggregate data from different sources to generate reports and visual representations, such as charts and graphs, to make the data more accessible and easier for users to interpret.
Common BI Tools
Commonly used BI tools across different business industries:
1. Tableau
Tableau is a recognized tool for data visualization and business intelligence. It’s often chosen for tasks like reporting and analyzing large data sets.
Tableau was founded in 2003, starting in the United States, and later became part of Salesforce through an acquisition in June 2019.
Users can use Tableau to create visual representations such as charts, graphs, maps, dashboards, and stories. These visual tools help present and analyze data, which can help make business decisions.
2. Microsoft Power BI
Power BI is a tool that combines different software services, apps, and connectors to help you make sense of your data. It has been developed by Microsoft.
It can connect to data stored in an Excel file or spread across various cloud-based or on-premises databases.
Once connected, it allows you to create visuals that help you understand and explore your data. You can then share these insights with others, making it easier for everyone involved.
3. Qlik Sense
Qlik Sense is also a BI solution that helps you create visual data representations. It was developed in 2014 by Qlik.
Qlik Sense allows users to work with large amounts of data, making it easier to understand and analyze the information. Helping to bring out important insights simplifies the process of sharing practical knowledge.
What is Data Analytics?
Data analytics is the process of studying raw data to understand and draw conclusions from it.
Instead of just looking at the data independently, certain techniques and methods are used to make sense of it.
Nowadays, many of these methods have become automated, meaning that algorithms can process this data, making it easier for people to use and understand.
Businesses often rely on data analytics to improve performance and increase profits. They achieve this by using different software and tools to collect and analyze the raw data.
Common Data Analytics Tools
A lot of tools are used in data analytics to assist in processing, analysis, and visualisation. A few of them are:
1. Python
Python is a programming language that offers flexibility, making it suitable for various tasks. Python has many libraries, which are code collections that help analyze data or perform complex calculations.
One of Python’s strengths is that it can be easily extended with libraries. There are thousands of libraries in Python that are explicitly designed for data analysis. The Python Data Analysis Library, often called Pandas, is very popular.
Regarding data analysis, most of the libraries you’ll find in Python are built on top of a basic library called NumPy. NumPy contains many tools for mathematical calculations, operations, and functions, which are the building blocks for many other data analysis tools in Python.
2. R
R analytics, or the R programming language, is a free tool. It is handy for data science, statistics, and visual data representations. R can be adapted to work with business intelligence platforms like Sisense, helping to extract the best insights from important business data.
When integrated with platforms like Sisense, R can perform various tasks. These tasks include performing statistical functions and creating predictive models, such as linear regression.
R also enables you to build and run these statistical models using data from Sisense, with the models being updated automatically whenever new data is added.
3. Excel
Microsoft Excel is a popular tool for working with data. It has many features that make it a favorite for analyzing information, and one of the most valuable features is its pivot tables.
These tables are widely used because they help people sort and summarize data in an organized way.
Excel is a complete package for managing data, where you can import your data, analyse it, refine it, and create visual charts and graphs to better understand the information.
Key Differences Between Business Intelligence and Data Analytics
The following table summarizes the difference between business intelligence and data analytics.
| Key Difference | Business Intelligence | Data Analytics |
| Focus | Historical and current data | Predictive and prescriptive insights |
| Purpose | Decision support and performance monitoring | Extracting insights and solving complex problems |
| Technique Used | Reporting, dashboards, trend analysis | Statistical analysis, machine learning, forecasting |
| Data Types | Primarily structured data | Structured, semi-structured, and unstructured data |
| Scope | More limited to specific business operations | Broader scope across various business functions |
| Outcome | Understanding past and present operation | Optimizing future outcomes and decision-making |
How do Business Intelligence and Data Analytics Complement Each Other?
As seen in the above table, BI and data analytics are different, but in some ways, they work in tandem to complement specific tasks. A few areas where these tools complement each other are:
1. Integration of Insights
- BI’s Role: Examines past and present data to guide decisions, providing clear reports and dashboards to help you spot trends and understand what’s happening now.
- DA’s Contribution: Forecast future trends and provide strategic advice using advanced methods. Combining the straightforward insights from BI with Data Analytics’ predictive power gives you a well-rounded understanding of your operations and the market’s future.
Imagine you’re steering a ship. BI tells you where you’ve been and how the waters are right now, while Data Analytics predicts the weather ahead, helping you chart the best course forward.
2. Problem Solving and Reporting
- BI’s Role: Goal-oriented, generating reports that inform operational decisions based on past performance. It helps businesses understand the “what” and “why” behind past events.
- DA’s Contribution: The problem solver, answering complex questions about future outcomes and optimizing processes. It doesn’t just identify challenges; it offers solutions. By using DA to uncover opportunities and pinpoint challenges, BI reports can be used to implement informed and effective strategies.
If BI is the detective, figuring out what happened in the past, DA is the strategist, planning the best way to tackle future challenges.
3. Supporting Strategic Planning
- BI’s Role: helping you see what’s happening now and what has happened in the past.
- DA’s Contribution: BI might reveal that sales have dropped in recent months, while Data Analytics analyzes customer behavior and market trends to predict future sales patterns. They allow businesses to make proactive decisions and better prepare for the future.
BI shows you the drop in sales, and DA predicts how upcoming market trends and customer preferences might affect future sales, helping you plan your next move with confidence.
4. User Accessibility
- BI’s Role: They are designed with user-friendliness in mind. They are accessible to a broad audience, including managers and executives without technical backgrounds, making data-driven decisions more feasible for everyone.
- DA’s Contribution: while powerful, analytics requires specialized statistics and programming skills. The complex nature of its tools means that while Data Analytics provides insights, BI tools offer a more accessible way for users to act on those insights.
A BI dashboard might present sales data in an easy-to-understand format, while Data Analytics could uncover deeper patterns or anomalies that data experts need to explore further.
Also read: Data Mining vs Business Intelligence: Detailed Comparison
Choosing the Right Approach for Your Business
Business intelligence helps you see the overall picture of your business. It helps spot trends and opportunities and provide guidance on where to put your resources wisely.
On the other hand, data analytics focuses on the finer details. It helps you understand what’s happening inside your organization and how to improve your everyday operations.
Which one should you pick?
Should you substitute data analysis for business intelligence? The answer depends on what you need.
Business intelligence might be the way to go if you want to make big decisions about your business’s future. Data analytics could be more helpful if you aim to enhance your daily operations.
But you don’t have to choose just one. Many businesses find it beneficial to use both business intelligence and data analytics. Combining these tools can give you a complete view of your business and help you make intelligent decisions at every level.
Conclusion
Simply having data isn’t enough—it must be transformed into actionable insights. Business Intelligence (BI) provides a clear snapshot of your current operations, while Data Analytics delves deeper, uncovering hidden opportunities and predicting future trends. To stay ahead of the competition, investing in BI and data analytics is crucial.
Contact us today to start leveraging your data and unlock your business potential for future success with our top-notch data analytics services.
Frequently Asked Questions
Q: Is Business Intelligence the same as Data Analytics?
No, they are not. Business Intelligence analyzes historical and current data to support decision-making, while Data Analytics uses advanced techniques to predict future trends and optimize outcomes.
Q: Which is better for my business, BI or Data Analytics?
The choice depends on your business needs. In most cases, combining both methods is the best way to get a complete picture when making data-driven decisions.
Q: Can BI and Data Analytics be used together?
Yes, BI and Data Analytics go hand in hand, and it is recommended that they be used together. By blending these two, you get a fuller picture of your data, which helps you make better decisions and find valuable insights.
Related Blogs

Power BI Cost: Comprehensive Guide to Pricing Plans
Compare different types of Power BI Licenses and their costs: Free, Pro, and Premium options explained. Discover which Power BI plan suits your business needs.
Tarsem Singh
Jun 30 ,
12 min read

Power BI Consultant Hourly Rates: How Much Does It Cost?
Struggling to understand the cost of hiring a Power BI consultant? Find out the Power BI consultant hourly rates, what factors influence the price and how to find the best value for your business.
Pranay Agrawal
Jun 30 ,
15 min read
Power BI Implementation: A Step-by-Step Guide for Businesses
Discover how to implement Power BI in your organization with this comprehensive guide. Learn essential steps and best practices for successful implementation.
Tarsem Singh
Jun 30 ,
12 min read


