![15 Top Business Intelligence Tools for 2025 [Features + Pricing]](https://scaleupally.io/wp-content/uploads/2024/10/business-intelligence-tools.png)
15 Top Business Intelligence Tools for 2025 [Features + Pricing]
Tarsem Singh | October 26, 2024 , 15 min read
Table Of Content
Do you know what is interesting about data? It is the heart of every business, big or small.
Yet, 74% of employees feel frustrated working with it. The good news is that with the right tools, managing data can be easy, and we have business intelligence tools to thank.
For that reason, we have hand-picked the top 15 of these tools designed to help organizations interpret their data in meaningful ways that will drive business growth.
Best Business Intelligence Tools in 2025
There are so many business intelligence solutions available for organizations of all types.
Some are designed for technical users, while others are user-friendly, making them accessible even for those without technical expertise.
Each of these tools does one task, turning data into insights.
Here are 15 such tools you can choose from:
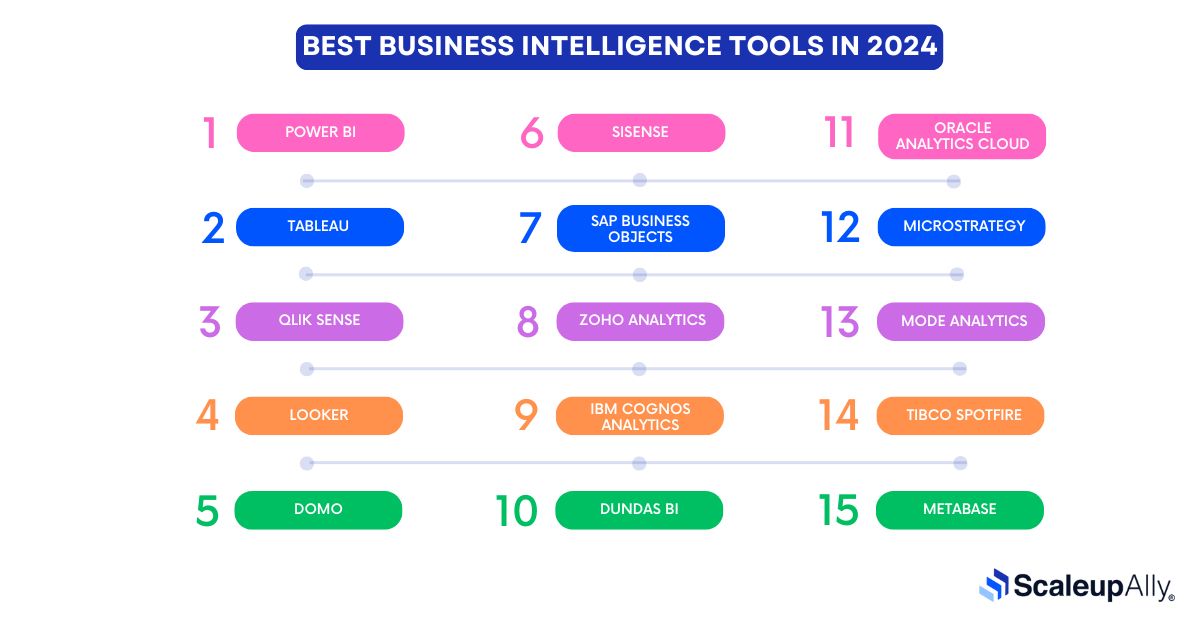
1. Power BI
Offered by Microsoft, Power BI is a set of tools, apps, and services that help you combine your scattered data into one coherent source for clear, interactive, and visually appealing insights.
Features
- Consolidate all your data into a central repository.
- Create reports in seconds.
- Integrate with our Microsoft services (eg: Outlook, 365, etc).
- Make queries in natural language.
- Integrated Dax Analysis functionality.
Strengths
- Access data via a Power BI App everywhere, anywhere with internet access.
- Developers can embed Power BI reports into applications to create more integrated user experience.
- Power BI integrates advanced AI capabilities.
Weakness
- The language used in Power BI is mostly DAX. However, only a limited number of actions can be performed using DAX Formulas.
- Highly dependent on the Microsoft ecosystem and may not do well with external systems
- Large datasets can slow down performance.
Pricing
- Power BI Pro: US$9.99 per user/month
- Power BI Premium: US$20 per user/month
Also Read: Power BI Pricing Plans: A Comprehensive Guide
2. Tableau
Tableau from Salesforce is favored by enterprises for its depth and flexibility. Its ability to create interactive and shareable dashboards takes big data and turns them into reports for decision makers.
Features:
- Presents your data in informative dashboards combining images, visual objects, text, and other components.
- Ability to connect and fetch data from local files, spreadsheets, relational and non-relational databases, data warehouses, big data, and on-cloud data.
- Features a fail-safe security system based on authentication and authorization mechanisms.
Strengths
- Supports different types of data files.
- Visualize spatial data to make geographical analyses.
- Designed to meet the requirements of both small and large-scale organizations with large volumes of data.
Weakness
- Users often face limitations in visual customization while working on complex datasets and unconventional data representation.
- Working on projects that include data summarisation and aggregation can be difficult due to the lack of data preparation features on Tableau.
- Tableau does not offer a scheduling option, so updating the reports and delivering data in a timely manner always require manual effort in the back end.
Pricing
- Tableau Creator: US$75 per user/month
- Tableau Explorer: US$42 per user/month
- Tableau Viewer: US$15 per user/month
- Enterprise Creator: US$115 per user/month
- Enterprise Explorer: US$70 per user/month
- Enterprise Viewer: US$35 per user/month
3. Qlik Sense
Qlik Sense offers a highly scalable and flexible data analytics platform. It’s perfect for businesses that need to explore data relationships without predefined paths, using its associative engine to offer new perspectives on complex datasets.
Features:
- With its associative model, users can view and draw original insights from such unique associations between data.
- Its self-service creation feature allows for easy app creation, data preparation, and data loading, by providing drag-and-drop features that bypass all the dealing with scripts and queries.
- Share Qlik Sense reports and applications with other users operating individually or as a group of users through a centralized and unified hub.
Strengths
- Due to the associative model, it is easy to link and integrate data.
- Compatible with all sorts of devices like desktops, tablets, laptops, and mobile phones.
- Share reports in formats like PDF, XLS, PowerPoint, etc
Weakness
- Clients using mobile devices like iPads, tablets, and phones have reported issues with screen size adjustments and problems with how desktop objects appear.
- If several files are run at once, the system may freeze, forcing users to restart tasks. Additionally, selecting multiple users is slow.
- The storytelling feature has some limitations because it doesn’t fully support languages like Japanese and Chinese.
Pricing
- Standard: US$825 per month
- Premium: US$2,500 per month
- Enterprise: Custom pricing
4. Looker
Looker is a cloud-based BI tool now owned by Google Cloud. It focuses on real-time data exploration and collaboration, empowering users to create custom reports and dashboards while integrating with cloud databases.
Features
- Centralize data from multiple sources into a single platform.
- Use LookML to create semantic data models.
- Scales with the needs of growing businesses.
Strengths
- Its data integration capabilities are advanced.
- Select from a wide range of customization options to create detailed reports and dashboards.
- The ability to manage complicated data structures and work with large amounts of data.
Weakness
- In an ideal situation, Looker Studio’s user interface would be more responsive and easier to use with large datasets, but unfortunately, that’s not the case.
- Data blending lets you combine information from different sources into one place for quick and clear insights. However, when it comes to handling large files, big companies and businesses need a similar feature, but Looker Studio doesn’t quite meet that need.
- The Looker Studio row limit restricts how much data you can manage. For PDFs and PNGs, the limit is 500 rows, but it increases in the browser. This limitation can frustrate users and lead to incomplete data analysis.
Pricing
- Custom pricing based on organization size and needs.
5. Domo
Domo combines data integration, visualization, and teamwork in one platform. It offers real-time data updates and is designed for mobile use so teams can access it easily.
Features
- Manage from mobile phones by accessing data anytime and keep teams connected at all times.
- The platform’s Business Cloud allows you to connect data from various sources, like cloud CRM, Google Analytics, and email, and turn it into live visualizations.
- DOMO allows users to easily access all the information they need to make informed decisions, no matter their level of technical skill or knowledge.
Strengths
- DOMO is the only cloud-native BI solution that combines Integrated Platform as a Service (iPaaS) for data integration, real-time visualizations, and predictive insights.
- The platform empowers business users to make their own decisions through self-service BI, allowing them to easily filter, segment, and analyze data.
- Anyone can easily pull data from various sources, process and transform it, and load it into the DOMO platform. Integration tools allow users to transform data with just a few clicks, while ETL solutions allow them to visualize data flow, set up operations, and preview changes in real time.
Weakness
- Since Domo is fully cloud-based, it handles all processing online, which can sometimes lead to slower speeds in some situations.
- Depending on your needs, Domo can be more expensive than some other options. Additionally, its pricing is not very clear.
- If you copy a report and edit the copy, it will also change the original report, which can be inconvenient.
Pricing
- Custom pricing based on organization needs
6. Sisense
Sisense is a BI platform for both large enterprises and small businesses. It allows users to manage, explore, and visualize data from multiple sources and embed analytics into other tools.
Features
- Users can monitor and integrate analytics into dashboards and widgets, creating a fully customizable and interactive experience.
- Four main user roles handle data governance: Admin, Designer, Data Designer, and Viewer. Admins can set detailed permissions for each role.
- It is suitable for businesses of all sizes and can be set up on your own servers, as a private cloud service, as a fully managed online service, or as a combination of these options.
Strengths
- A drag-and-drop interface allows you to visualize data without writing code.
- Enable users to combine raw data from various sources for easy querying and visualizing.
- Helps users understand and work with data by providing an easy-to-use data pipeline.
Weaknesses
- Data preparation and modeling can be challenging for non-technical staff, so they often need IT support.
- While Sisense’s Elasticube allows for fast access to large data sets, it can be difficult for average users to set up and requires a lot of technical skills.
- Sisense offers fewer data visualization options compared to other strong visualization tools.
Pricing
- Custom pricing depending on business size and needs.
7. SAP BusinessObjects
SAP BusinessObjects is a suite of business intelligence tools designed to offer reporting, analysis, and data visualization across industries. It’s particularly strong in operational reporting and is popular among larger enterprises.
Features
- Create and share reports in one easy-to-use platform.
- Combine data from several sources to create a single report for a complete view.
- Perform what-if analysis.
Strengths
- Excellent for large organizations.
- Comprehensive options for customizing reports.
- Operational and real-time reporting for organizations.
Weaknesses
- It takes a lot of effort and time to learn to use this tool.
- Expensive licensing.
- Requires technical expertise to manage.
Pricing
- Custom pricing.
8. Zoho Analytics
Zoho Analytics is an easy-to-use business intelligence platform that allows you to create dashboards and analyze your data independently.
Features
- Has a drag-and-drop report builder.
- Contains AI-powered data insights.
- Integrates with Zoho’s ecosystem.
Strengths
- Affordable for small businesses.
- Easy to use, even for non-technical users.
- Great integration with Zoho CRM and apps.
Weaknesses
- Limited features compared to enterprise BI tools.
- Slower with large datasets.
- Has a less active community and support compared to larger tools.
Pricing
- Basic: US$22 per month for 2 users
- Standard: US$45 per month for 5 users
- Premium: US$112 per month for 15 users
- Enterprise: US$445 per month for 50 users
9. IBM Cognos Analytics
An enterprise-grade BI tool that helps businesses turn data into insights through AI-driven analytics. It’s known for its deep analytics capabilities and its ability to generate custom reports.
Features
- Has AI-powered insights and recommendations.
- Customize reports and dashboards.
- Integrate with IBM Watson.
Strengths
- AI and machine learning features.
- Scalable for enterprise use.
- Excellent data governance.
Weaknesses
- Expensive for small businesses.
- Not friendly for non-technical users.
- Not easy to set up and use.
Pricing:
- Custom pricing based on requirements.
10. Dundas BI
Dundas BI is a data analytics platform that delivers visualizations and interactive dashboards. Its interface is customizable, and it can integrate with numerous data sources.
Features
- A drag-and-drop interface.
- Customizable visualizations.
- Embeddable analytics.
Strengths
- Highly customizable.
- Real-time data insights.
- Great for embedding BI into other platforms.
Weaknesses
- Can be too complex for non-technical users.
- Requires time to set up and customize.
- Expensive for small businesses.
Pricing
- Custom pricing.
11. Oracle Analytics Cloud
Oracle Analytics Cloud offers a suite of BI tools for businesses that need data visualization and AI-powered analytics. Its integration with other Oracle products makes it a great option for businesses using the Oracle ecosystem.
Features
- Machine learning-powered analytics.
- Automated Insights.
- Integration with Oracle products.
Strengths
- AI and ML capabilities.
- Great for Oracle customers.
- Highly scalable.
Weaknesses
- Expensive compared to competitors.
- Not as user-friendly for beginners.
- Requires significant IT involvement.
Pricing
- Custom pricing.
12. MicroStrategy
MicroStrategy is an enterprise-level BI tool that combines advanced analytics with mobile BI solutions. It offers data visualizations and reporting, with a focus on cloud scalability and AI-driven insights.
Features
- Mobile-friendly BI solutions.
- Cloud-based analytics.
- AI-powered predictive insights.
Strengths
- Excellent for mobile BI.
- Strong focus on cloud scalability.
- Advanced analytics features.
Weaknesses
- Expensive for smaller companies.
- Requires a technical team for setup.
- Complex interface for beginners.
Pricing
- Custom pricing.
13. Mode Analytics
Mode Analytics is designed for data scientists and analysts who need a tool for SQL-based data exploration. It offers a clean interface for collaborative analysis and provides real-time visualizations based on custom queries.
Features
- SQL-based data exploration.
- Collaborative analytics and sharing.
- Real-time visualizations.
Strengths
- Ideal for technical users.
- Excellent for real-time data exploration.
- Strong collaborative features.
Weaknesses
- Not user-friendly for non-technical users.
- Limited pre-built templates.
- Requires SQL knowledge.
Pricing
- Free for small teams, custom pricing for enterprises.
14. TIBCO Spotfire
TIBCO Spotfire is a BI tool offering a mix of AI-powered analytics, visualization, and data wrangling features. It’s especially known for its predictive analytics and ability to work with real-time data streams.
Features
- Predictive analytics with AI and ML.
- Data wrangling and cleansing tools.
- Real-time data visualization.
Strengths
- Excellent for predictive analytics.
- Handles complex data with ease.
- Customizable dashboards.
Weaknesses
- Complex for non-technical users.
- Steeper learning curve.
- Expensive for small businesses.
Pricing
- Custom pricing.
15. Metabase
Metabase is an open-source BI tool that makes analytics accessible to businesses without requiring deep technical knowledge. It allows users to create simple dashboards and reports without needing to write SQL queries
Features
- Easy-to-use, open-source platform.
- Visual query builder.
- Embedded analytics for third-party apps.
Strengths
- Completely free for small teams.
- Simple interface for non-technical users.
- Supports a variety of data sources.
Weaknesses
- Limited advanced features.
- Less customizable than paid alternatives.
- Requires setup and hosting for self-service.
Pricing
- Free for the open-source version; paid plans for cloud hosting.
How to Choose the Right BI Tool for Your Business?
After exploring the top 15 business intelligence solutions, you’ve likely identified each tool’s strengths and weaknesses. Choosing the right one for your business can be challenging, but here are a few tips to help guide your decision.
1. What is your End Goal?
To find the best BI platform among the cluster of business intelligence tools, you will need to define your needs.
What are your expectations or desired outcomes from a BI tool? Is your focus on cloud based BI tools or traditional on-premise solutions?
Defining your requirements will help you filter out options that don’t align with your objectives.
2. Compare Features and Integration
After drafting your requirements and choosing some potential BI reporting tools, compare their features to see how they weigh out.
Focus on whether it is permissible to integrate with your existing systems or not. An ideal business intelligence tool should offer some integration capabilities with your CRMs, ERPs, or Data sources.
3. Test before Committing
Most BI platforms offer free trial periods or demos so test these platforms before committing fully. When testing, focus on usability, customization options, and overall performance.
The tool must also be user-friendly for your team and have the features you need at a price point that fits your budget.
We hope the above described points will help you to choose a suitable BI tool for your organization.
But if it’s still a challenge, we totally understand it. It’s not always easy.
However, we can help you find clarity in this chaos of data and choices. Every business has its own story, and with the right BI tool, we can help you tell yours in a way that drives real impact.
If you’re ready to take that next step and harness the full power of your data, connect with us!. Let’s make your business smarter together.
Also read: BI Testing: A Comprehensive Guide For 2025
Conclusion
The 15 business intelligence tools we’ve explored together showcase the best of 2025, but BI is constantly evolving, with new tools emerging and existing ones being upgraded.
Be on the lookout and stay up to date.
With the tips provided, you’re now equipped to choose the tool that fits your needs. Whichever you choose, we hope it delivers valuable insights to help drive your business to new heights.
Frequently Asked Questions
Q: What is a business intelligence tool?
A business intelligence tool is software that helps businesses collect, analyze, and visualize data to make informed decisions.
Q: Which business intelligence tool is the best?
The best BI tool depends on your business needs. Popular choices include Power BI, Tableau, and Looker.
Q: Which BI tools offer the best value for money?
Tools like Power BI, Looker Studio, and Metabase are often considered to offer the best value for money.
Q: Is SQL a business intelligence tool?
SQL itself is not a business intelligence tool, but it’s commonly used within BI tools to manage databases. Many BI platforms allow users to run SQL queries to extract and analyze data.
Q: How much do business intelligence tools typically cost?
The cost of BI tools varies from free options like Looker Studio to Tableau or Power BI, which may charge per user, per month, often between US$10-100 or more.
References:
Related Blogs

Data Warehouse Cost Breakdown: Factors, Pricing Models & Platform Comparison
Discover how much a data warehouse costs in 2025. Explore pricing models, key factors, and platform comparisons to plan your data budget effectively.
Tarsem Singh
Nov 6 ,
14 min read

How Much Do Integrations Cost? [Pricing Breakdown & Key Insights]
Learn how much integrations cost, key factors influencing pricing, hidden expenses to avoid, and effective ways to reduce integration costs.
Tarsem Singh
Nov 6 ,
9 min read
Power BI for Inventory Management: A Comprehensive Guide
Explore the hidden power of Power BI for inventory management and how it provides businesses with powerful analytics and visualization capabilities.
Tarsem Singh
Oct 8 ,
19 min read

