
Power BI for retail store
Tarsem Singh | May 24, 2024 , 9 min read
Table Of Content
Power BI is a suite of analytics and data visualization tools specifically offered by Microsoft for Business Intelligence (BI). The key differentiators of this product are namely its easy-to-navigate dashboards, self-service interactive reports and compelling high-quality visuals.
It must be remembered that implementing an inventory management technique by using Power BI can be done easily. Another key point is you simply have to install Power BI, import all your data into the suite, and get stunning analytical visuals. Given below are some well-known data sources:
- Excel workbook (CSVs, XMLs), JSON files and SharePoint
- Databases – SQL Server, MS Access, Oracle, IBM DB2, Sybase IQ, PostgreSQL, Teradata, SAP Hana and Analysis Services
- Microsoft Azure (Database, Data Warehouse, Blob Storage, Table Storage, and Data Lake Store)
- Online Service – SharePoint Online List, Microsoft Exchange Online, Microsoft Dynamics 365, Facebook, and Salesforce
- Other sources – Excel Range, Table, Web page, Microsoft Query, OData Feed, Hadoop Distributed File System, Microsoft Exchange Server, Active Directory, ODBC source, OLEDB source, and Blank Query.
A Power BI report can indeed be a single visual or multiple visuals on a single page.
Key Takeaways
- Power BI helps retailers analyze customer behavior, track fast-moving products, predict future demand, and make informed decisions on inventory and marketing.
- Power BI enables retailers to get detailed analysis of sales metrics, inventory turnover, vendor lead times, and stock levels, aiding in better inventory management.
- Power Bi requires no technical expertise, integrates seamlessly with applications, ensures data security, and is a cost-efficient alternative to other BI tools.
- By leveraging Power BI, retailers can streamline operations, reduce inventory issues, and gain actionable insights to drive sales and customer satisfaction.
Benefits of Power BI in the Retail Industry
Power BI provides customer analytics that retail stores can use to understand their business, such as which products are moving fast and which will be in demand in the future. It also offers sales metrics analysis, inventory management, and customer analytics, which can help retailers make informed decisions regarding inventory levels, reordering, and marketing efforts.
Struggling with Power BI Speed?

How Power BI for Retail Store Can be a Game Changer
The retail business is in fact driven by consumer behavior overall. BI is generally required to analyze this and predict customer requirements. Power BI generates customer analytics that can be used by your retail store particularly to understand your business. For instance: which Stock Keeping Units (SKUs) are moving fast, and which products would be in demand in the future. From an inventory perspective, particularly Power BI presents a data set that shows the relationship between orders, stock control, and sales for any given month.
To demonstrate, a list of few metrics analyzed by Power BI are given below:
- Sales metrics: With Power BI, you can specifically get an analysis of total sales and sales quantity category/sub-category wise over a period of time.
- Variance analysis: Moreover, you can get weekly, monthly, and yearly sales variance analysis.
- Vendor lead time: To point out, you can compare the lead time from different suppliers under a product category/sub-category. For example: metrics such as Average Lead Time, Average Stock per Product Category, and a tree-map visualization of all KPIs.
- Inventory analysis: In addition, you can view stock on hand and get metrics such as Economic Order Quantity, Danger Level, and Re-order level.
- Inventory turnover: Above all, by looking at the Power BI output, you can classify the movement of your products and monitor the Inventory Turnover Ratio.
If you’re looking for an AI-powered solution to help you with your retail business, you may want to check out ScaleupAlly. We offer expert Power BI services for the retail industry that can help you streamline your operations, boost your sales, and improve your customer experience. Their expert team has years of industry experience and can provide you with the insights and tools you need to succeed.
You may like to read: Power BI for Inventory Management
Practical Example
For example: The availability and actual sales of a few product categories are given below.
Table 1: Availability (no. of units) and Actual Sales (no. of units)
| Item Name | Availability (units) | Sales (units) |
| Touring Bikes | 25 | 10 |
| Mountain Bikes | 20 | 18 |
| Road Bikes | 22 | 21 |
| Tyres and Tubes | 18 | 15 |
| Jerseys | 25 | 15 |
| Bottles | 24 | 20 |
| Gloves | 22 | 10 |
| Helmets | 40 | 30 |
The figure below shows the output for the above data in the form of a line graph on Power BI desktop interface.
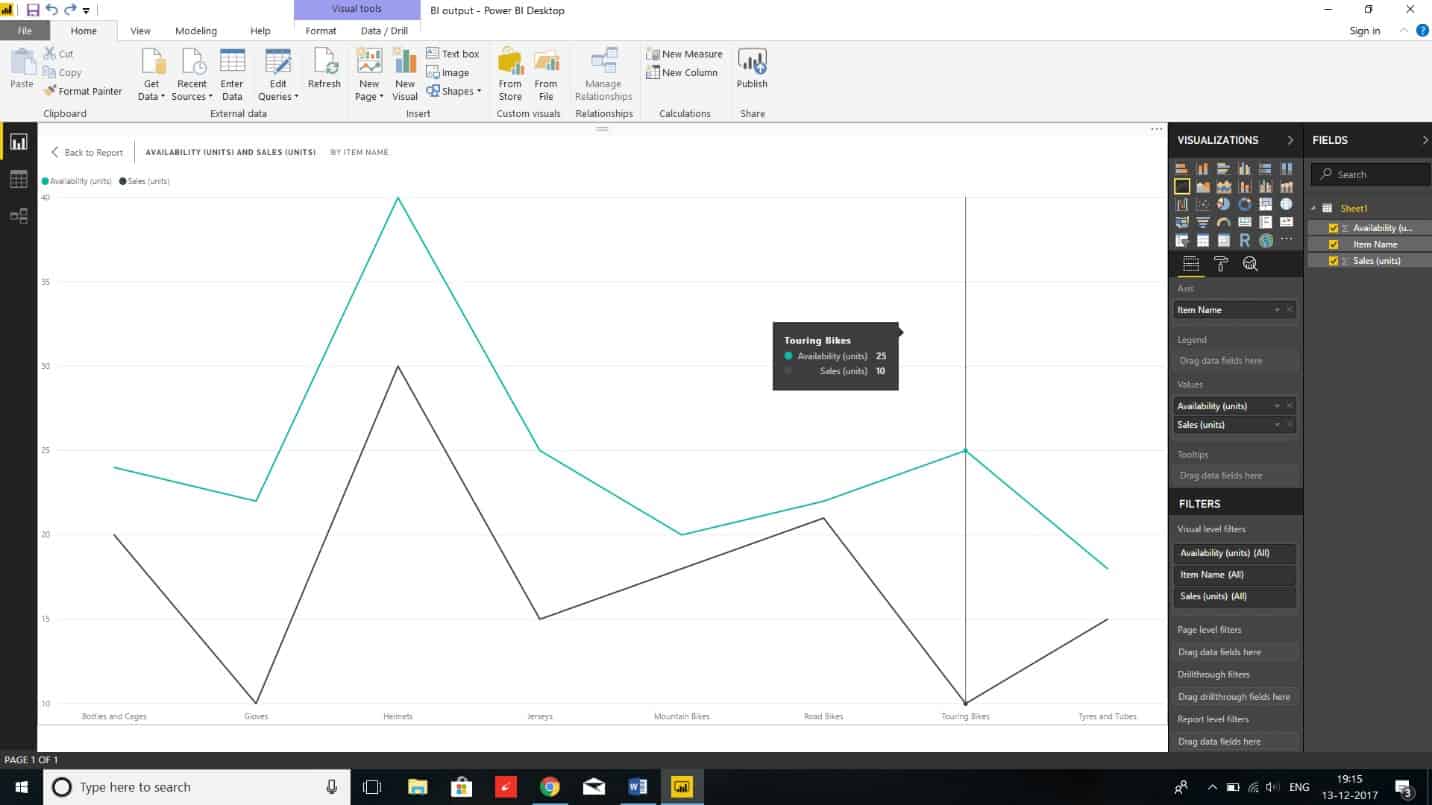
For instance, the figure shows how Power BI gives various analysis output options on the dashboard such as graphs/charts/diagrams/slicers/tables/standalone images/treemaps etc. Besides, you can choose to view your output in any form you like.
Power BI for retail store, here's how we can help?
In fact, Power BI is one of the best analytical tools available in the market today to reduce inventory problems in your retail store. This is because it has a plethora of output options and visuals. ScaleupAlly can indeed help you by analyzing your store data using Power BI and ensure that you never face inventory problems.
Without a doubt, inventory dashboards created by us using Power BI are stunning and visually rich. They have high levels of security, governance and further seamlessly integrate with applications. Additionally, they can support advanced data analysis, and require no technical knowledge to use. Besides, all this comes at a fraction of cost you will currently be spending on other BI tools.
Conclusion
Power BI is an efficient and user-friendly tool that can help retailers make data-driven decisions based on customer analytics, sales metrics, and inventory analysis. By leveraging Power BI’s power, retail stores can gain valuable insights into their business and make informed decisions regarding inventory levels, reordering, and marketing efforts. With its ability to analyze vast amounts of data and provide compelling, high-quality visuals, Power BI is a game-changer for the retail industry.
Frequently Asked Questions
Q: How secure is the data stored in Power BI?
Power BI uses industry-standard security practices to protect your data, including encryption, access controls, and compliance with data protection regulations such as GDPR and HIPAA. You can also configure additional security measures, such as data encryption and multi-factor authentication, to further enhance the security of your data.
Q: Can Power BI help me forecast sales and plan inventory levels?
Yes, Power BI includes forecasting features that allow you to predict future sales based on historical data. You can use these forecasts to plan inventory levels, optimize stock replenishment schedules, and anticipate demand fluctuations.
Q: How much does Power BI cost for retail stores?
Power BI offers a range of pricing plans, including a free version with limited features and paid plans with additional capabilities. The cost depends on the specific features and usage requirements of your retail store, so it’s best to contact Microsoft or a Power BI reseller for a customized quote.
Q: Can Power BI help me track the performance of my retail store across multiple locations?
Yes, Power BI can consolidate data from multiple store locations and generate reports and dashboards that provide insights into each location’s performance. You can compare sales performance, inventory levels, and customer behavior across locations to identify trends and opportunities for improvement.

Related Blogs
Power BI Cost: Comprehensive Guide to Pricing Plans
Compare different types of Power BI Licenses and their costs: Free, Pro, and Premium options explained. Discover which Power BI plan suits your business needs.
Tarsem Singh
Jun 30 ,
12 min read

Power BI Consultant Hourly Rates: How Much Does It Cost?
Struggling to understand the cost of hiring a Power BI consultant? Find out the Power BI consultant hourly rates, what factors influence the price and how to find the best value for your business.
Pranay Agrawal
Jun 30 ,
15 min read
Power BI Implementation: A Step-by-Step Guide for Businesses
Discover how to implement Power BI in your organization with this comprehensive guide. Learn essential steps and best practices for successful implementation.
Tarsem Singh
Jun 30 ,
12 min read
Our Promise
Let’s build something extraordinary together.