Vijay Construction
Building Success: A Power BI Case Study for Vijay Construction
Builder and Construction
Power BI Reports
2
Starting up & Scaling up

Introduction
Vijay Construction is a prominent Malaysia-based infrastructure services provider specializing in projects such as viaducts, flyovers, metros, bridges, pipelines, roads, ports, and more. To effectively monitor and manage their diverse range of infrastructure projects, Vijay Construction initiated a Business Intelligence (BI) project. Their primary goal was to track the status of ongoing projects using data from Postgres SQL and Excel sources.
Business Objective
The key objectives of Vijay Construction’s BI project were as follows:
- Project Status Tracking: Develop a system to monitor the status of their various infrastructure projects.
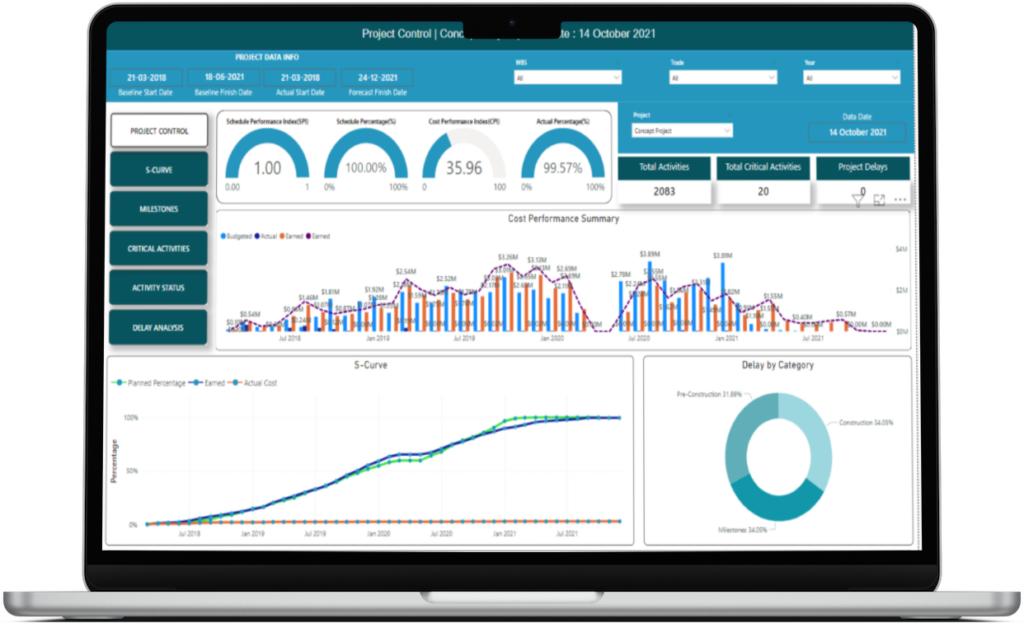
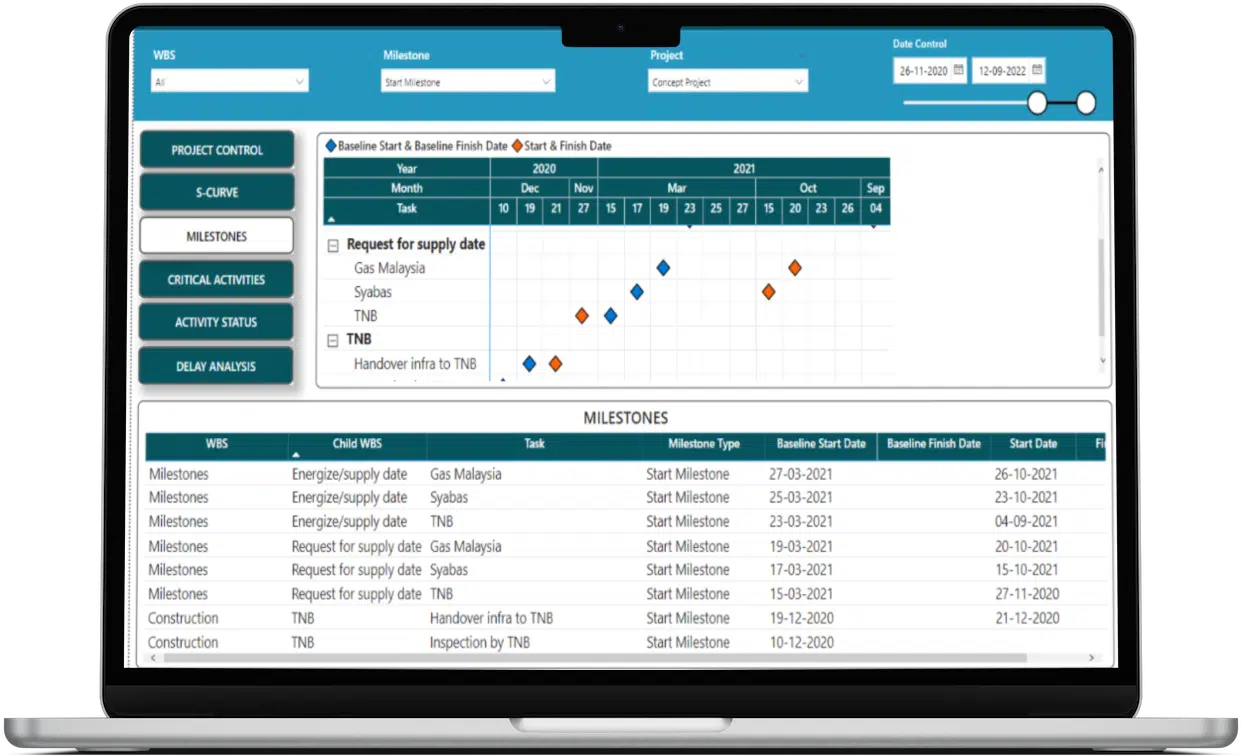
- Data Visualization: Create informative reports to track Total Activities, Total Critical Activities, Project Delays, Milestones, and other key performance indicators.
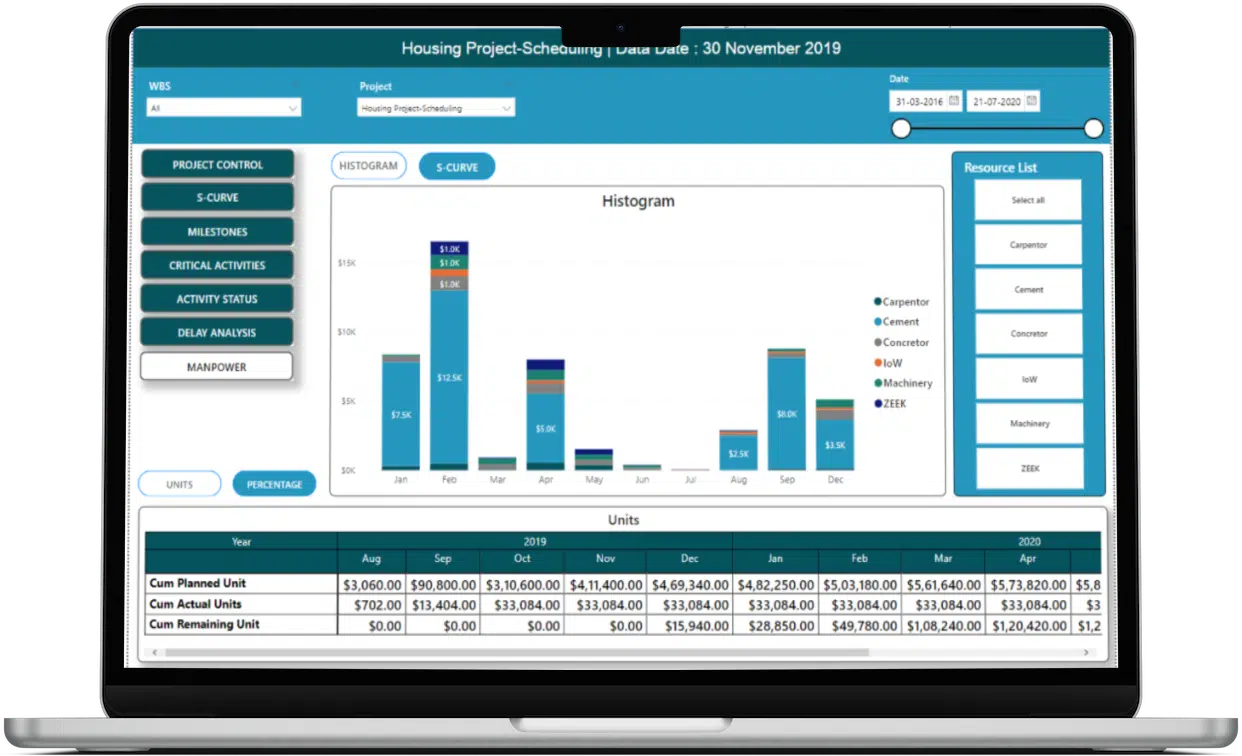
- Drill-Down Capability: Implement slicers and filters to enable users to drill down into project data based on different time frames, such as date and month.
Project Scope
- Data Integration: Gather and integrate data from Postgres SQL and Excel sources.
- Vijay Construction’s BI initiative encompassed several important components:Technology Stack: Utilize Power BI for report generation and SQL for data retrieval and transformation.
Data Collection and Integration
- Data Sources: Primary source – Postgres SQL, Supplementary source – Excel.
- Data Integration: Power BI used for data integration and visualization.
- Data Transformation: SQL employed for data retrieval and transformation from Postgres SQL.
Key Performance Indicators (KPIs)
- Project Progress Tracking Efficiency: Timeliness and accuracy of project status updates.
- Data Visualization Effectiveness: User engagement with Power BI reports.
- Drill-Down Capability Utilization: Frequency of users utilizing slicers and filters.
- Data Integration Efficiency: Time taken for data integration from multiple sources.
- Data Security Compliance: Adherence to data security standards.
- Customization Success: User satisfaction with tailored Power BI reports.
- Project Metrics Monitoring: Accuracy in tracking project performance metrics.
BI Tools and Technologies
- Data Integration: Power BI for data integration and visualization.
- Data Retrieval and Transformation: SQL for data retrieval and transformation from Postgres SQL.
- Supplementary Data Management: Excel is used for supplementary data sources.
Data Analysis and Insights
- Data Extraction and Integration: NES Health’s data extraction and integration processes were meticulous, ensuring that data from AWS SQL, Excel spreadsheets, and the proprietary health platform were accurately represented in the unified dataset.
- Power BI Reports: NES Health’s Power BI reports were meticulously designed, offering interactive dashboards and reports that empowered users to explore data, identify trends, and gain valuable insights into both sales and health analytics.


Challenges and Solutions:
- Data Integration: Integrating data from multiple sources required careful planning and development to ensure a seamless flow of project data.
- Data Security: Ensured data connections and storage met stringent security standards to protect sensitive project information.
- Customization: Tailored Power BI reports were designed to meet Vijay Construction’s specific project metrics and objectives.
- Drill-Down Implementation: Implementing slicers and filters provided users with the ability to explore project data based on different time frames, enhancing data analysis capabilities.
Conclusion
Vijay Construction successfully leveraged Power BI to track the status of their diverse infrastructure projects effectively. The integration of data from Postgres SQL and Excel sources, along with the use of SQL for data retrieval and transformation, streamlined their project reporting process.
The Power BI reports provided Vijay Construction with valuable insights into project performance metrics, allowing for informed decisions on Total Activities, Total Critical Activities, Project Delays, Milestones, and more. This BI project exemplifies the power of data visualization and centralization in enhancing project management and decision-making within the construction and infrastructure sector, where monitoring project status is crucial for successful project delivery.


