Strata Market
Navigating Almond Markets: A Power BI Case Study for Strata Markets
Data and market intelligence services
Power BI Reports
4
Starting up & Scaling up

Introduction
Strata Markets is a leading independent provider of almond price indexes, almond prices, and market news and analysis for the global almond market. With a mission to empower their clients with data-driven insights, they sought to streamline their data reporting and analysis process. They embarked on a Business Intelligence (BI) project to consolidate and visualize their data related to daily price indications, monthly shipments, and market trends.
Business Objective
The primary objectives of Strata Markets’ BI project were as follows:
- Data Consolidation: To centralize and consolidate data from various sources related to almond pricing and market trends.
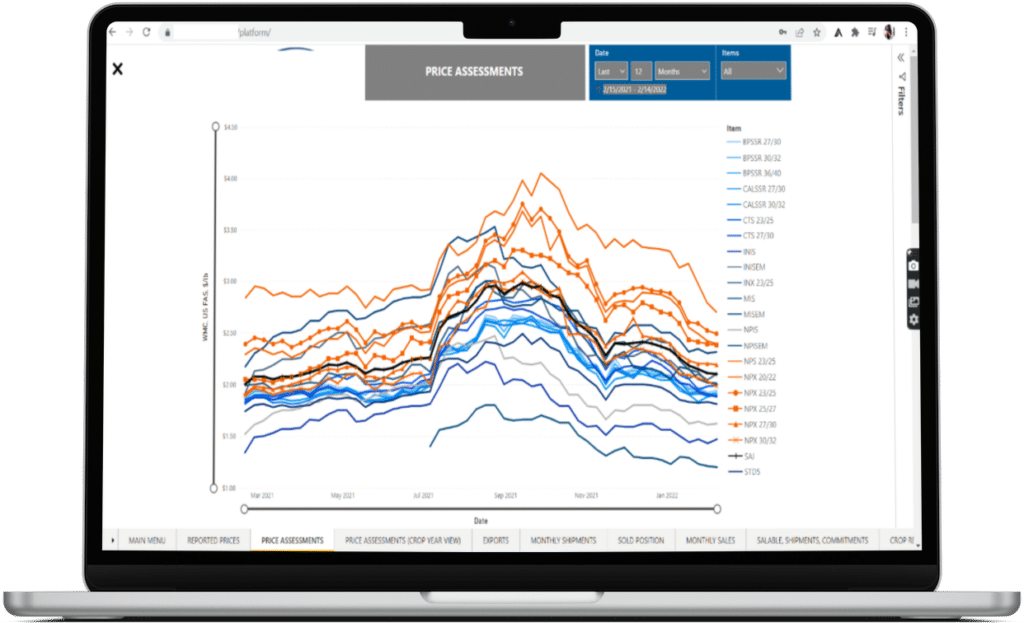
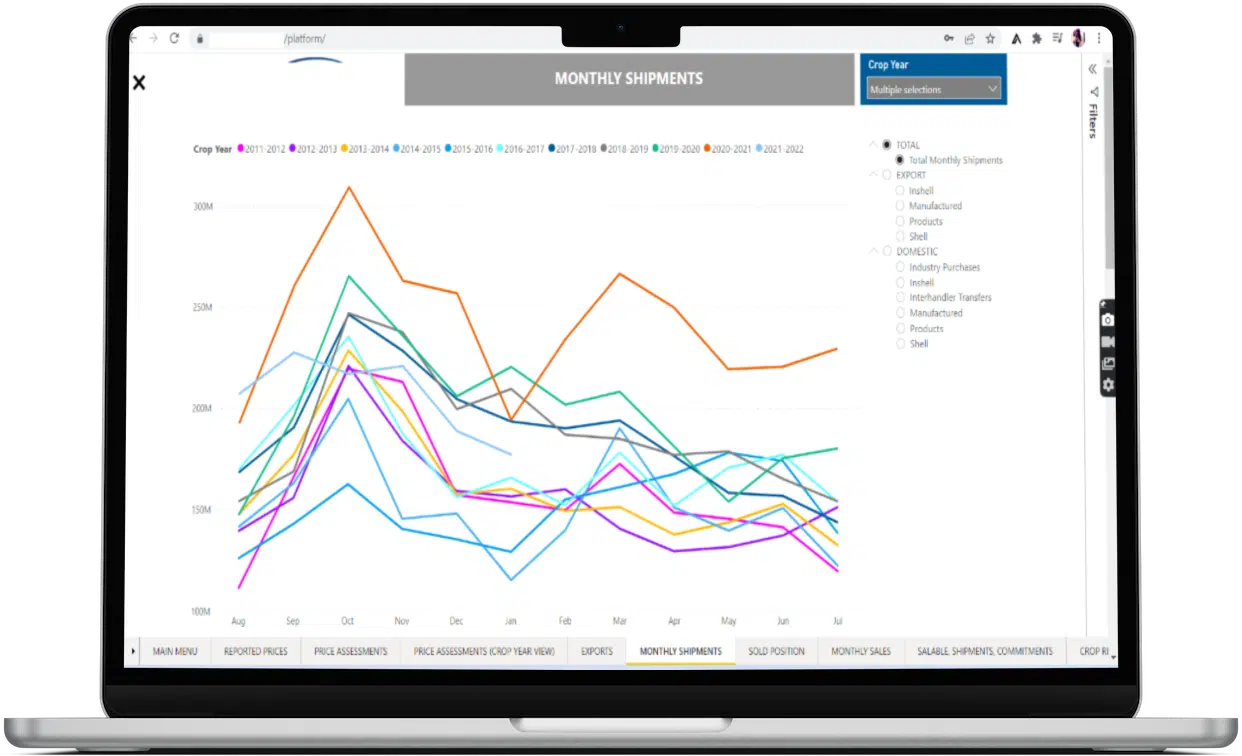
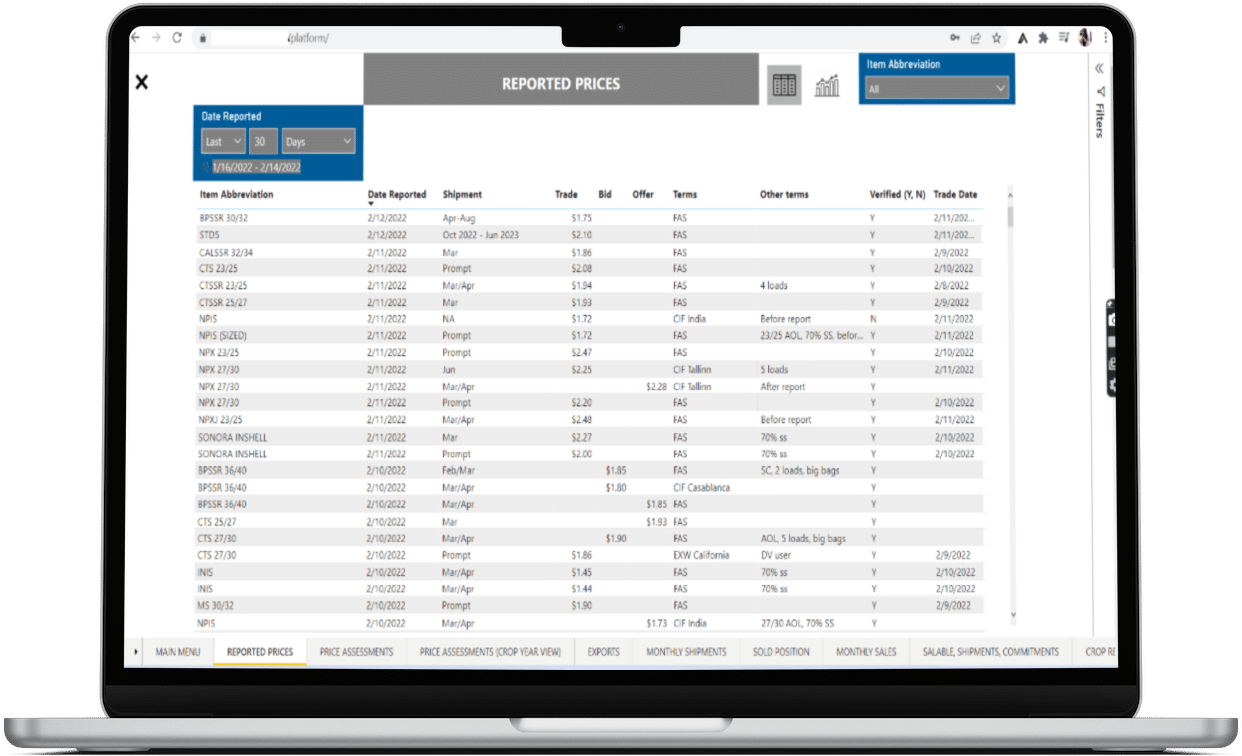
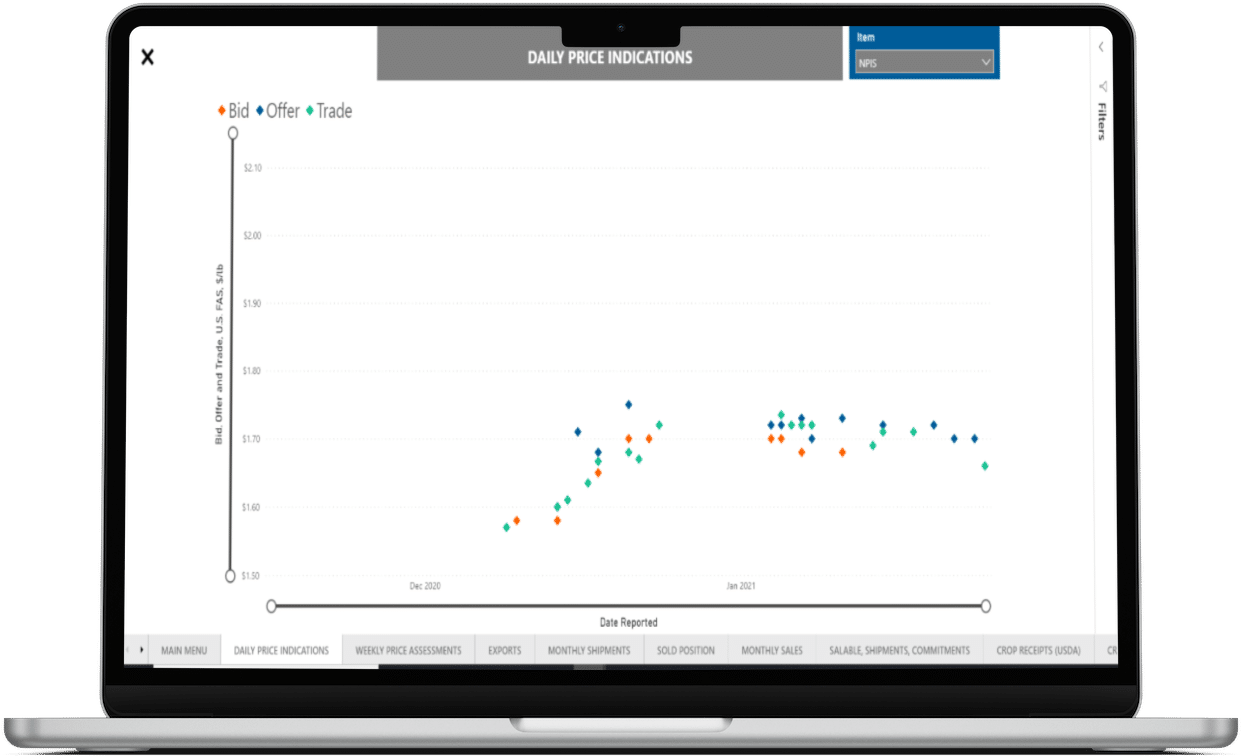
- Data Visualization: To create comprehensive and visually appealing reports that provide insights into daily price indications, monthly shipments, and other key metrics.
- Accessibility: To embed these reports into their website, allowing internal teams to access and analyze data easily.
Project Scope
- Data Integration: Centralizing data from AWS SQL and Excel sources to ensure a unified and consistent view.
- Technology Stack: Leveraging PHP for data integration, Power BI for report generation, and Power BI Embedding for seamless access to reports on their website.
Data Collection and Integration
- AWS SQL: The primary source for housing their data related to almond pricing, market trends, and daily price indications.
- Excel: Supplementary data sources for specific metrics and insights.
- Data Integration: PHP scripts were developed to gather data from various sources, ensuring a streamlined data flow.
- Data Visualization: Power BI was chosen as the tool for creating interactive and visually engaging reports.
- Accessibility: Power BI Embedding was utilized to embed the reports into their website for easy access.
Key Performance Indicators (KPIs)
- Data Consolidation Efficiency: Measure the time taken to centralize and consolidate data from various sources to streamline the consolidation process for improved accuracy and consistency.
- Data Visualization Effectiveness: Evaluate user engagement with Power BI reports, such as time spent and interactions, to ensure visually appealing and user-friendly reports.
- Accessibility Metrics: Monitor user logins and access frequency to embedded Power BI reports on the website to gauge user adoption and ease of access for internal teams.
- Data Integration Efficiency: Measure the time taken for PHP scripts to gather and integrate data from different sources to optimize data integration processes.
- Data Security Compliance: Assess compliance with data security standards and protocols, especially for sensitive market data, to ensure data protection.
- Customization Success: Gather user feedback and assess satisfaction with tailored Power BI reports to determine whether reports meet specific market metrics and objectives effectively.
- Daily Price Indications Monitoring: Track daily price trends, fluctuations, and their impact on decision-making to enable proactive pricing strategies based on real-time market data.
- Monthly Shipments Analysis: Analyze monthly shipment trends, patterns, and forecasting accuracy to improve market planning and forecasting based on historical shipment data.
BI Tools and Technologies
- Data Integration: PHP scripts were developed to gather data from various sources, ensuring a streamlined data flow.
- Data Visualization: Power BI was chosen as the tool for creating interactive and visually engaging reports.
- Accessibility: Power BI Embedding was utilized to embed the reports into their website for easy access.
Data Analysis and Insights
- Data Extraction and Integration: Data from AWS SQL and Excel sources was centrally integrated and processed to ensure data accuracy and consistency.
- Power BI Reports: Interactive dashboards and reports were developed in Power BI, enabling users to explore data, identify trends, and gain insights into the almond market.
- Daily Price Indications: Monitoring daily price indications and price trends helped in decision-making regarding pricing strategies.
- Monthly Shipments: Tracking monthly shipments and analyzing shipment trends provided valuable insights for market planning and forecasting.
- Accessibility: Embedding Power BI reports into their website allowed internal teams to log in with their credentials and access the reports seamlessly.


Challenges and Solutions:
- Data Integration: Developing PHP scripts for efficient data integration and transformation helped consolidate data from various sources.
- Data Security: Ensured that data connections and storage met stringent security standards to protect sensitive market data.
- Customization: Tailored Power BI reports were designed to meet Strata Markets’ specific market metrics and objectives.
- Accessibility: Power BI Embedding allowed for the integration of reports into their website, ensuring easy and secure access for internal teams.
Conclusion
Strata Markets successfully leveraged Power BI to centralize, visualize, and make data-driven decisions based on their almond market data. The integration of data from AWS SQL and Excel sources, along with the use of PHP for data integration and Power BI Embedding, streamlined their data reporting process.
The Power BI reports provided Strata Markets with valuable insights into daily price indications, monthly shipments, and market trends. Embedding these reports into their website allowed internal teams to access and analyze data effortlessly, facilitating data-driven decision-making in the competitive almond market. This BI project exemplifies the power of data visualization and accessibility in enhancing market analysis and decision-making.


