QI Spine
A Healthy Backbone for Business: A Power BI Case Study for QI Spine
Healthcare
Business Intelligence
3
Starting up & Scaling up

Introduction
QI Spine, India’s first spine care clinic dedicated to non-surgical treatments for back and neck pain, embarked on a transformative Business Intelligence (BI) project to enhance their business operations. This initiative aimed to provide QI Spine with comprehensive insights into their sales, operations, and marketing performance, ultimately optimizing their processes and improving patient care.
Business Objective
- Data Analysis: Harness data analytics to gain valuable insights into sales, operations, and marketing performance.
- Data Visualization: Develop informative and visually appealing reports to facilitate decision-making.
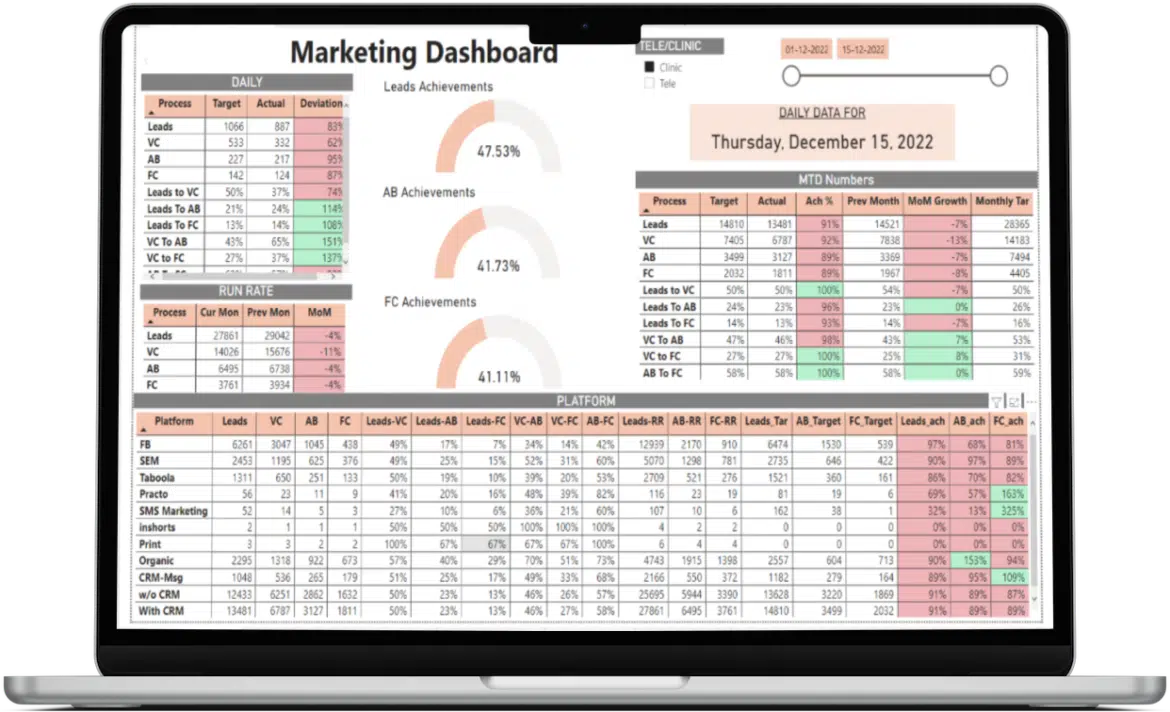
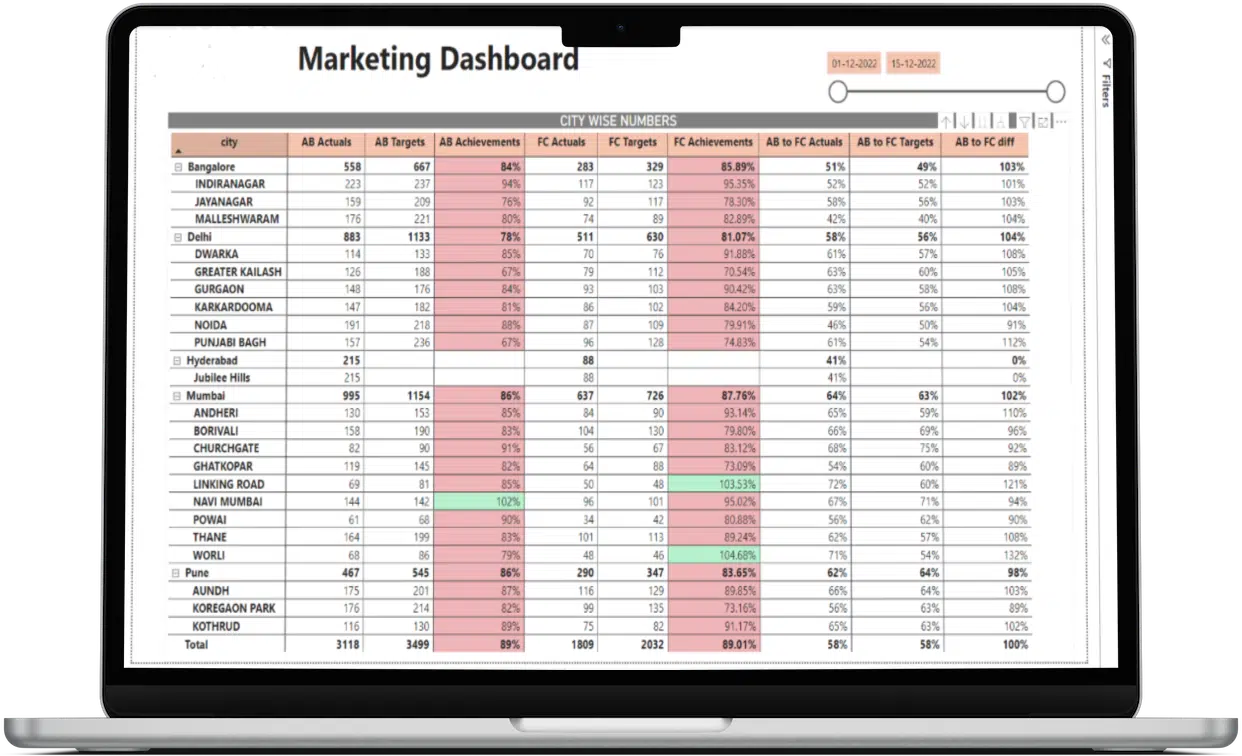
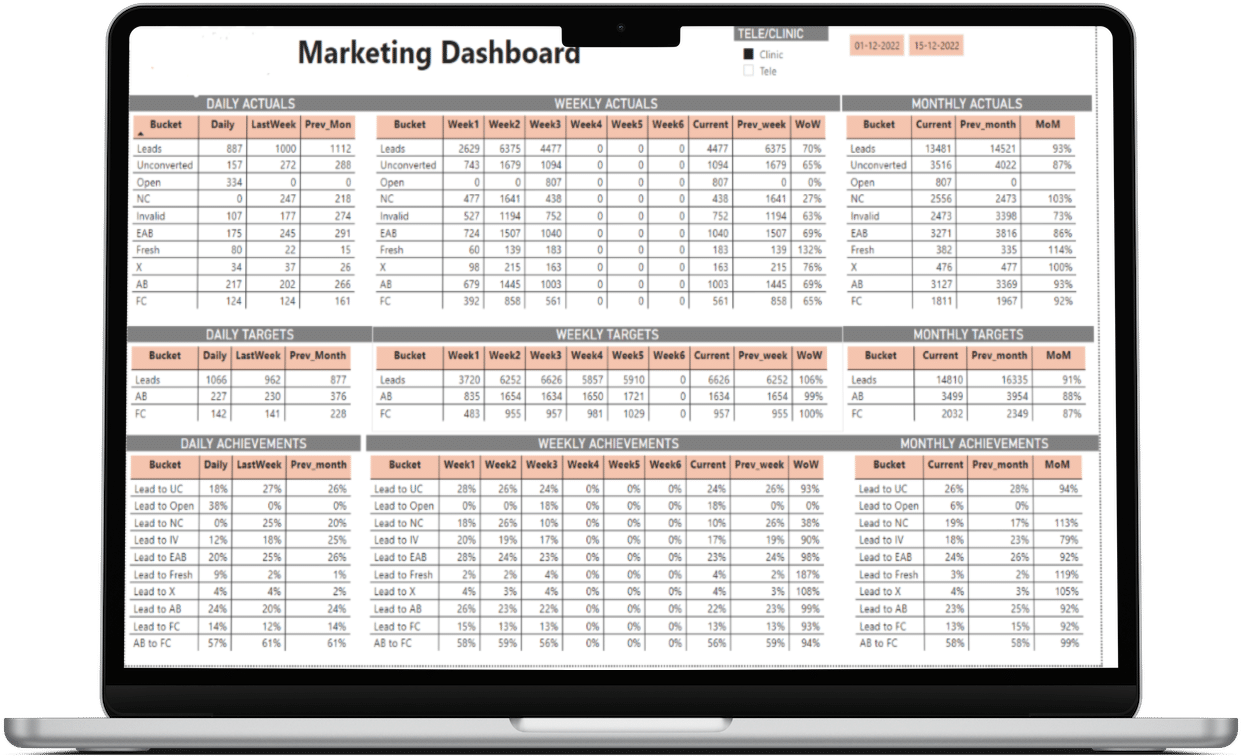
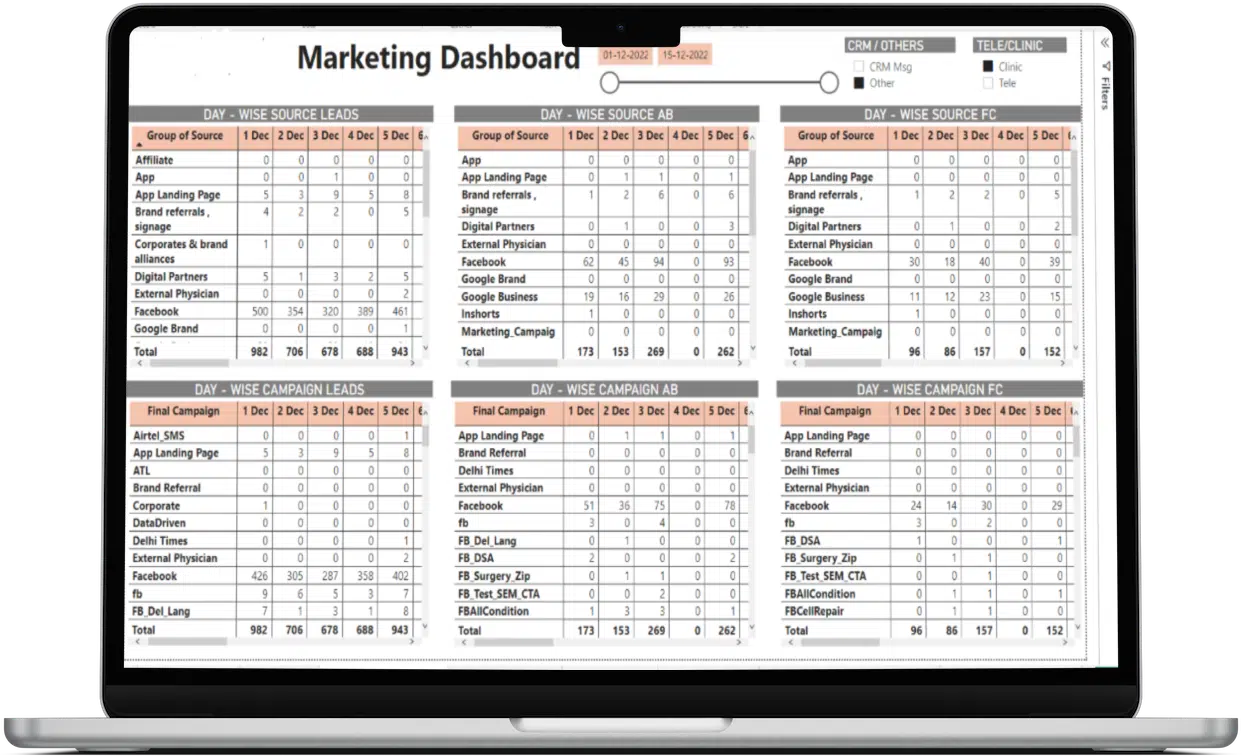
- Performance Tracking: Create reports for monitoring daily marketing activities, city-wise marketing effectiveness, and performance against predefined targets.
Project Scope
- Data Source: The primary data source was a PostgreSQL database housing vital information related to sales, operations, and marketing.
- Technology Stack: Power BI was selected as the reporting tool for its capability to connect directly to the PostgreSQL database and create interactive reports.
Data Collection and Integration
PostgreSQL: The central repository for storing critical data related to various aspects of QI Spine’s operations, including sales, operations, and marketing.
Key Performance Indicators (KPIs)
- Data Analysis Efficiency
- Data Visualization Effectiveness
- Marketing Campaign Success
- City-Wise Marketing Impact
- Performance Against Targets
BI Tools and Technologies
- Data Integration: Power BI for data integration and visualization.
- Data Retrieval and Transformation: Power BI directly queried the PostgreSQL database.
- Supplementary Data Management: PostgreSQL served as the primary data repository.
Data Analysis and Insights
- Data Extraction: Data was efficiently extracted from the PostgreSQL database using Power BI’s direct query functionality.
- Power BI Reports: Interactive dashboards and reports were meticulously designed within Power BI to enable users to explore data, identify trends, and gain insights.
- Daily Marketing Activities: Monitoring daily marketing activities allowed for the evaluation of campaign effectiveness and helped in optimizing marketing budgets.
- City-Wise Marketing Analysis: Analyzing marketing efforts in different cities provided actionable insights for targeting strategies to increase patient reach.
- Performance Analysis: Reports comparing actual performance against predefined targets facilitated a comprehensive performance evaluation, enabling QI Spine to track and achieve their business goals more effectively.


Challenges and Solutions:
- Data Integration: Connecting Power BI to the PostgreSQL database required the establishment of appropriate database connections and queries, which were efficiently managed.
- Data Security: Strict adherence to data security standards ensured the protection of sensitive business information.
- Customization: Power BI reports were thoughtfully tailored to meet QI Spine’s specific business metrics and objectives, ensuring that the reports aligned with their strategic goals.
Conclusion
QI Spine successfully harnessed the capabilities of Power BI to gain valuable insights into their sales, operations, and marketing performance. By directly querying the PostgreSQL database, they streamlined their data reporting process and achieved data-driven decision-making in their spine care clinic operations.
The Power BI reports provided QI Spine with comprehensive information on daily marketing activities, city-wise marketing performance, and performance against predefined targets. This BI project exemplifies the effectiveness of data visualization and analysis in optimizing business processes within the healthcare sector, where data-driven decisions are paramount for providing quality patient care and improving operational efficiency.


