Patriot Environmental
Streamlining Environmental Excellence: A Power BI Case Study for Patriot Environmental
Environmental Services
Power BI Reports
3
Starting up & Scaling up

Introduction
Patriot Environmental Services is a leading provider of comprehensive environmental, waste, and national response services, offering round-the-clock support to customers and industries across various sectors. Recognizing the importance of data-driven decision-making, Patriot Environmental initiated a Business Intelligence (BI) project to centralize and analyze data from multiple sources, including AWS SQL, Excel, and their Enterprise Resource Planning (ERP) system. The goal was to generate reports related to Finance & Accounting performance and Employee Performance.
Business Objective
- Data Centralization: Centralize data from diverse sources to establish a unified view.
- Data Visualization: Create comprehensive, visually engaging reports for analyzing Finance & Accounting performance and Employee Performance.
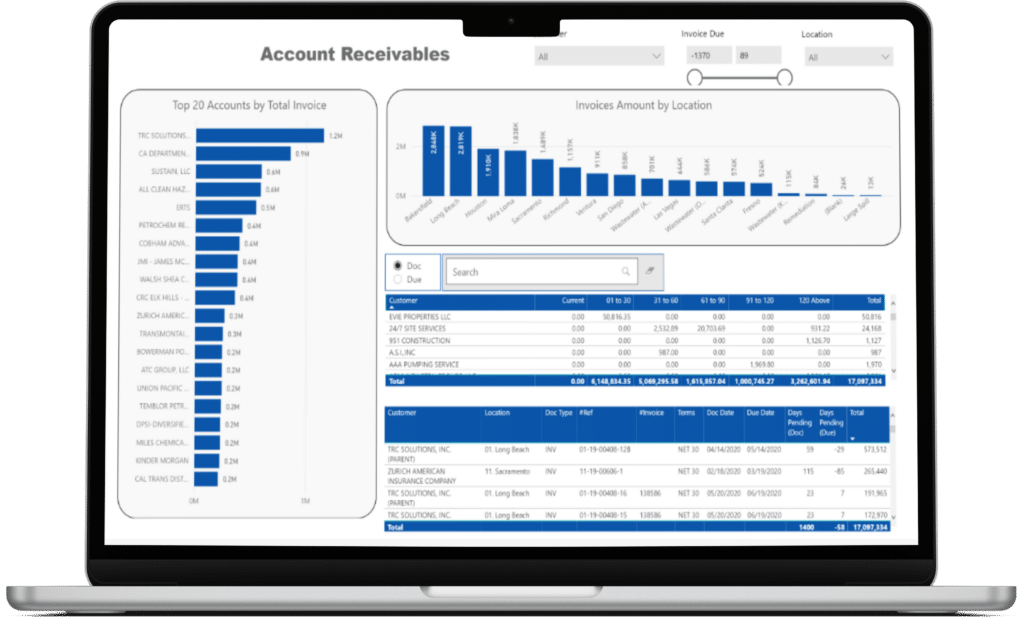
- Performance Metrics: Provide insights into various financial aspects such as Accounts Receivable, Accounts Payable, Invoice vs Payments, Sales and Billing, as well as Employee Performance metrics.
Project Scope
- Data Integration: Gather and integrate data from AWS SQL, Excel, and the ERP system.
- Technology Stack: Utilize PHP for data integration, Power BI for report generation, and Excel and MS Access for supplementary data sources.
Data Collection and Integration
Data for the project was sourced from various platforms, including AWS SQL, Excel spreadsheets, and the Patriot Environmental Enterprise Resource Planning (ERP) system.
- AWS SQL: This primary data source housed critical information related to finance, accounting, operations, and other aspects of the company’s activities.
- Excel Spreadsheets: Supplementary data sources were utilized for specific metrics and insights that complemented the main data repository.
- ERP System: The ERP system served as a central data repository, containing essential financial transaction data and comprehensive employee records.
Key Performance Indicators (KPIs)
- Accounts Receivable Turnover Ratio: Monitor receivables collection efficiency.
- Accounts Payable Turnover Ratio: Track payables management effectiveness.
- Invoice vs. Payments Accuracy: Ensure billing accuracy.
- Sales Growth Rate: Measure revenue growth.
- Billing Accuracy: Minimize billing errors.
- Daily Dashboard Engagement: Assess user interaction and engagement.
- Employee Turnover Rate: Monitor and reduce turnover for retention.
BI Tools and Technologies
- Power BI: Utilized for creating interactive and visually compelling reports.
- PHP: Developed scripts for efficient data integration and transformation.
- Excel and MS Access: Employed for managing supplementary data sources.
- AWS SQL: Primary data source for finance, accounting, and operations data.
- ERP System: Central repository for financial transactions, employee records, and more.
Data Analysis and Insights
- Data Extraction and Integration: Data from AWS SQL, Excel, and the ERP system was extracted and transformed to ensure data accuracy and consistency.
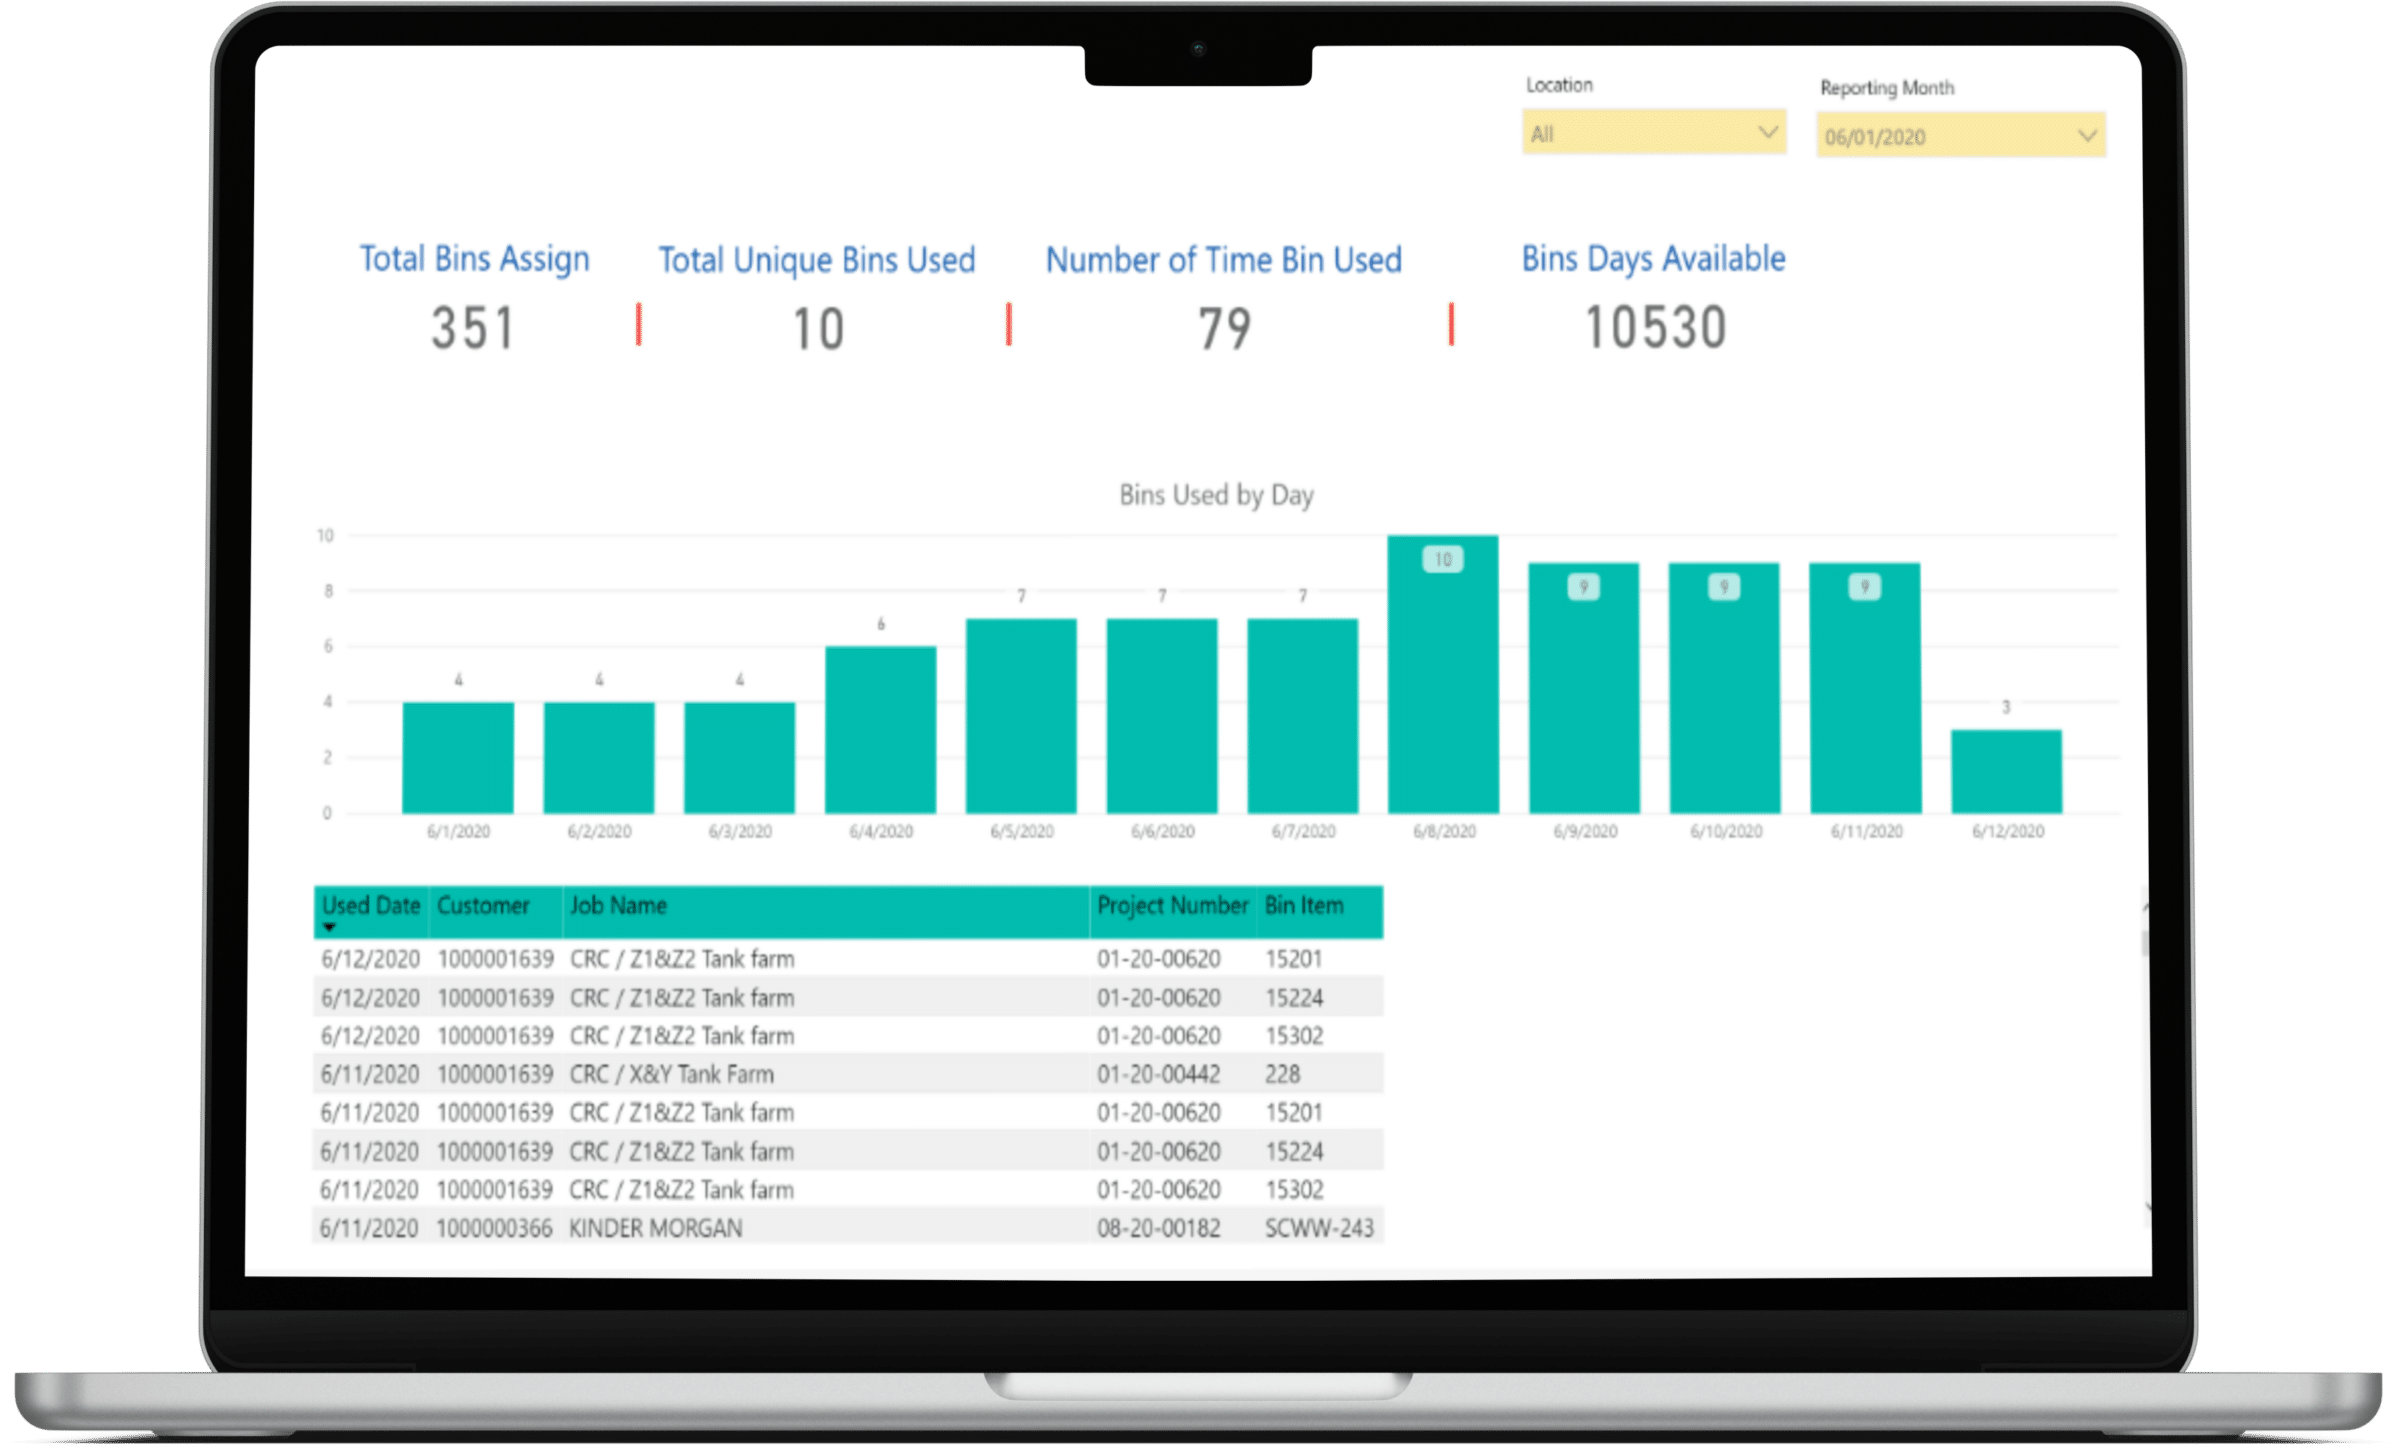
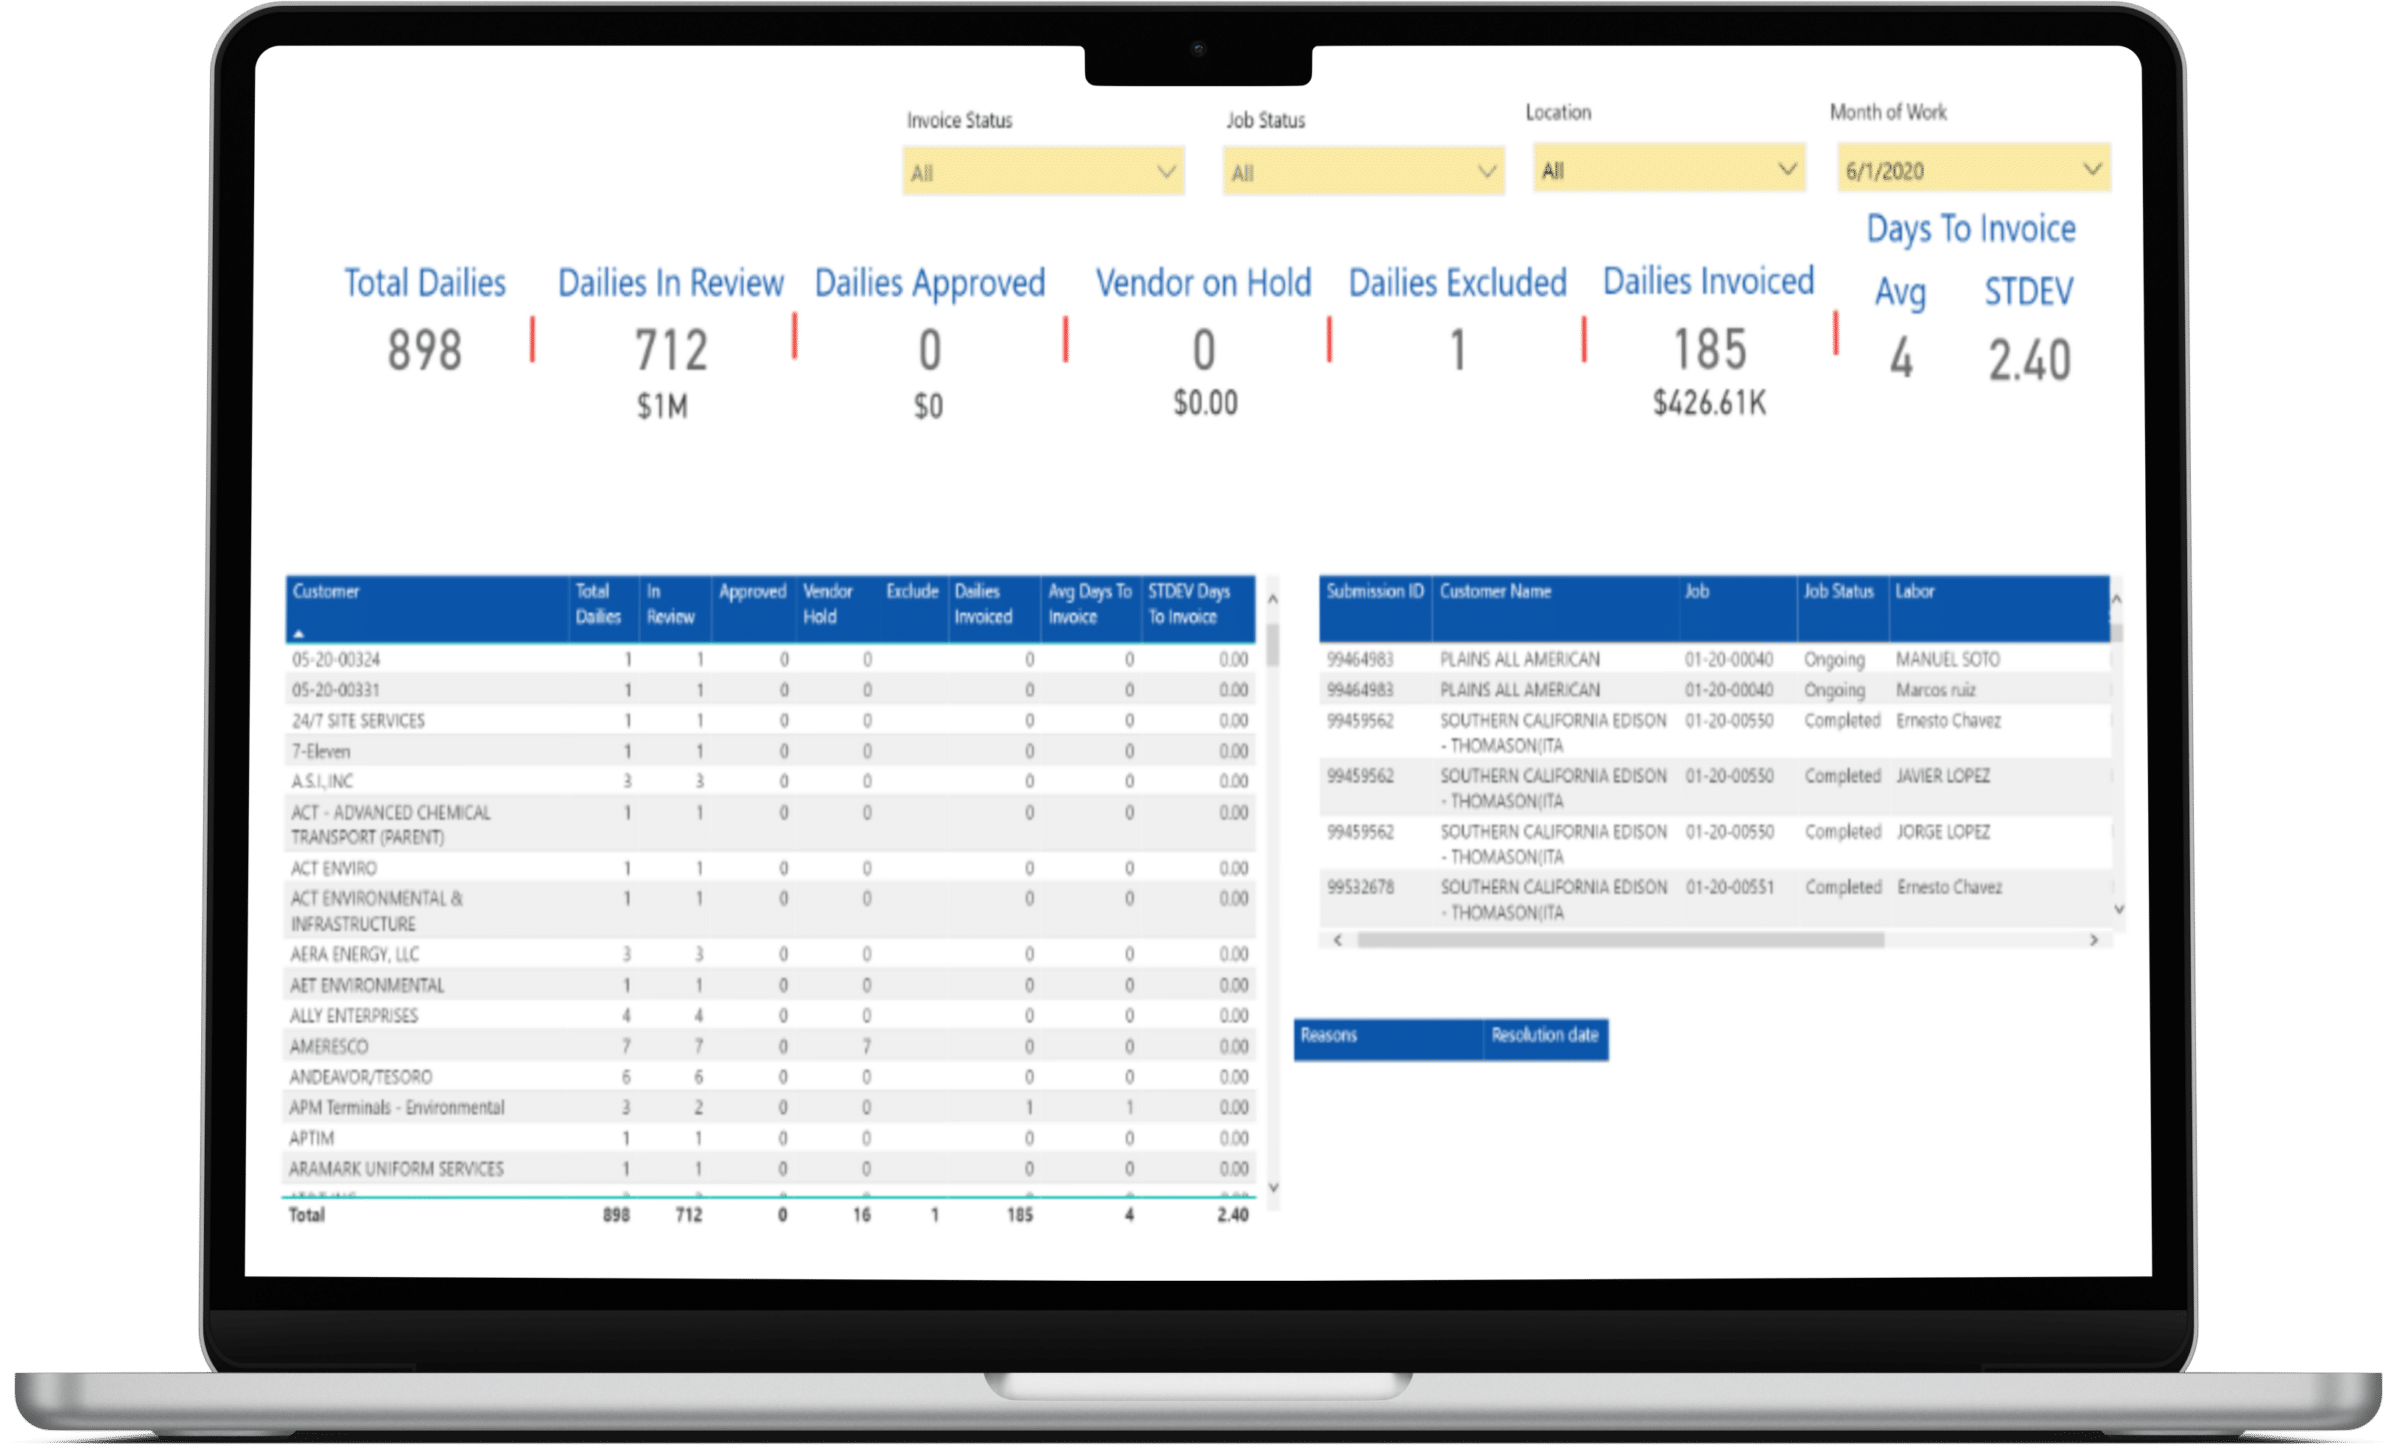
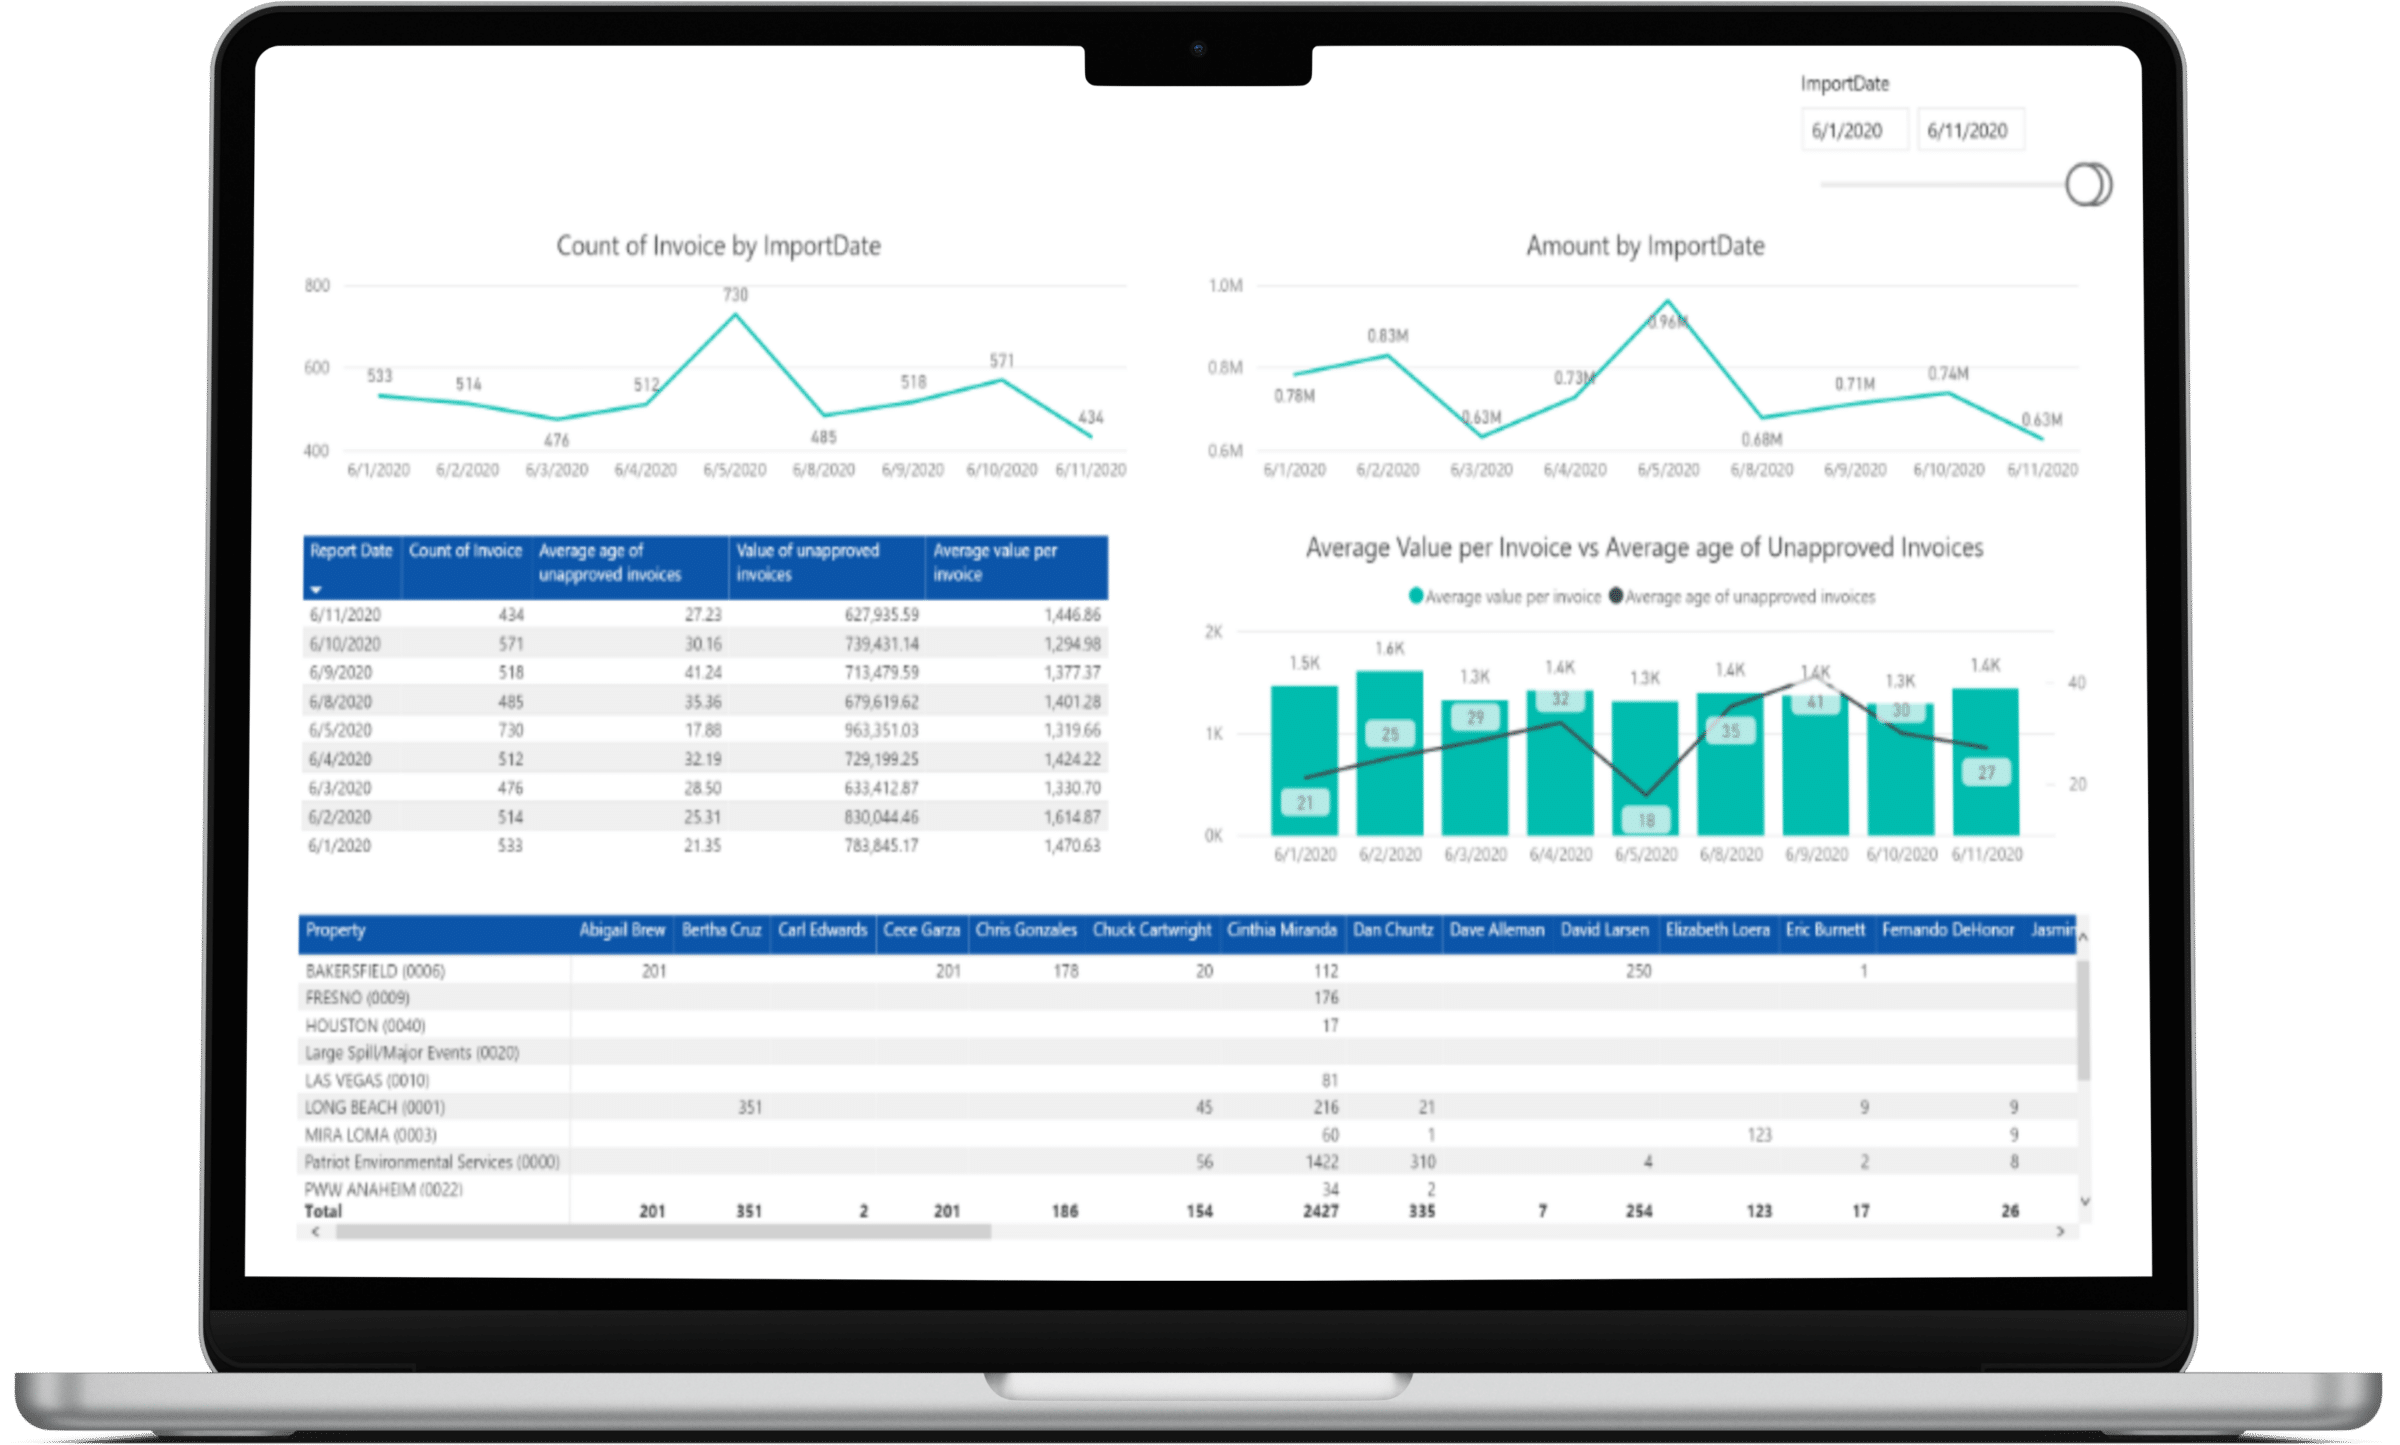
- Power BI Reports: Interactive dashboards and reports were developed in Power BI, enabling users to explore data, identify trends, and gain insights into finance & accounting and employee performance.
- Finance & Accounting Performance: Monitoring metrics such as Accounts Receivable, Accounts Payable, Invoice vs Payments, Sales and Billing provided a clear understanding of financial health and performance.
- Employee Performance: Analyzing Payroll Comparison, Daily Dashboard, and other employee-related metrics allowed for informed HR decisions.


Challenges and Solutions:
- Data Integration: Developing PHP scripts for efficient data integration and transformation helped consolidate data from various sources.
- Data Security: Ensured data connections and storage met stringent security standards to protect sensitive financial and employee data.
- Customization: Tailored Power BI reports were designed to meet Patriot Environmental’s specific financial and employee performance metrics and objectives.
- Supplementary Data Management: Excel and MS Access were employed to manage supplementary data sources, enhancing data completeness and accuracy.
Conclusion
Patriot Environmental successfully utilized Power BI to centralize, visualize, and make data-driven decisions based on their Finance & Accounting performance and Employee Performance metrics. The integration of data from AWS SQL, Excel, and the ERP system, along with the use of PHP for data integration, streamlined their data reporting process.
The Power BI reports provided Patriot Environmental with valuable insights into financial health, including Accounts Receivable, Accounts Payable, Invoice vs Payments, Sales and Billing, and employee performance metrics. This BI project exemplifies the power of data visualization and centralization in enhancing financial and HR analysis and decision-making within the environmental services sector, where data-driven insights are crucial for informed operations and growth.


