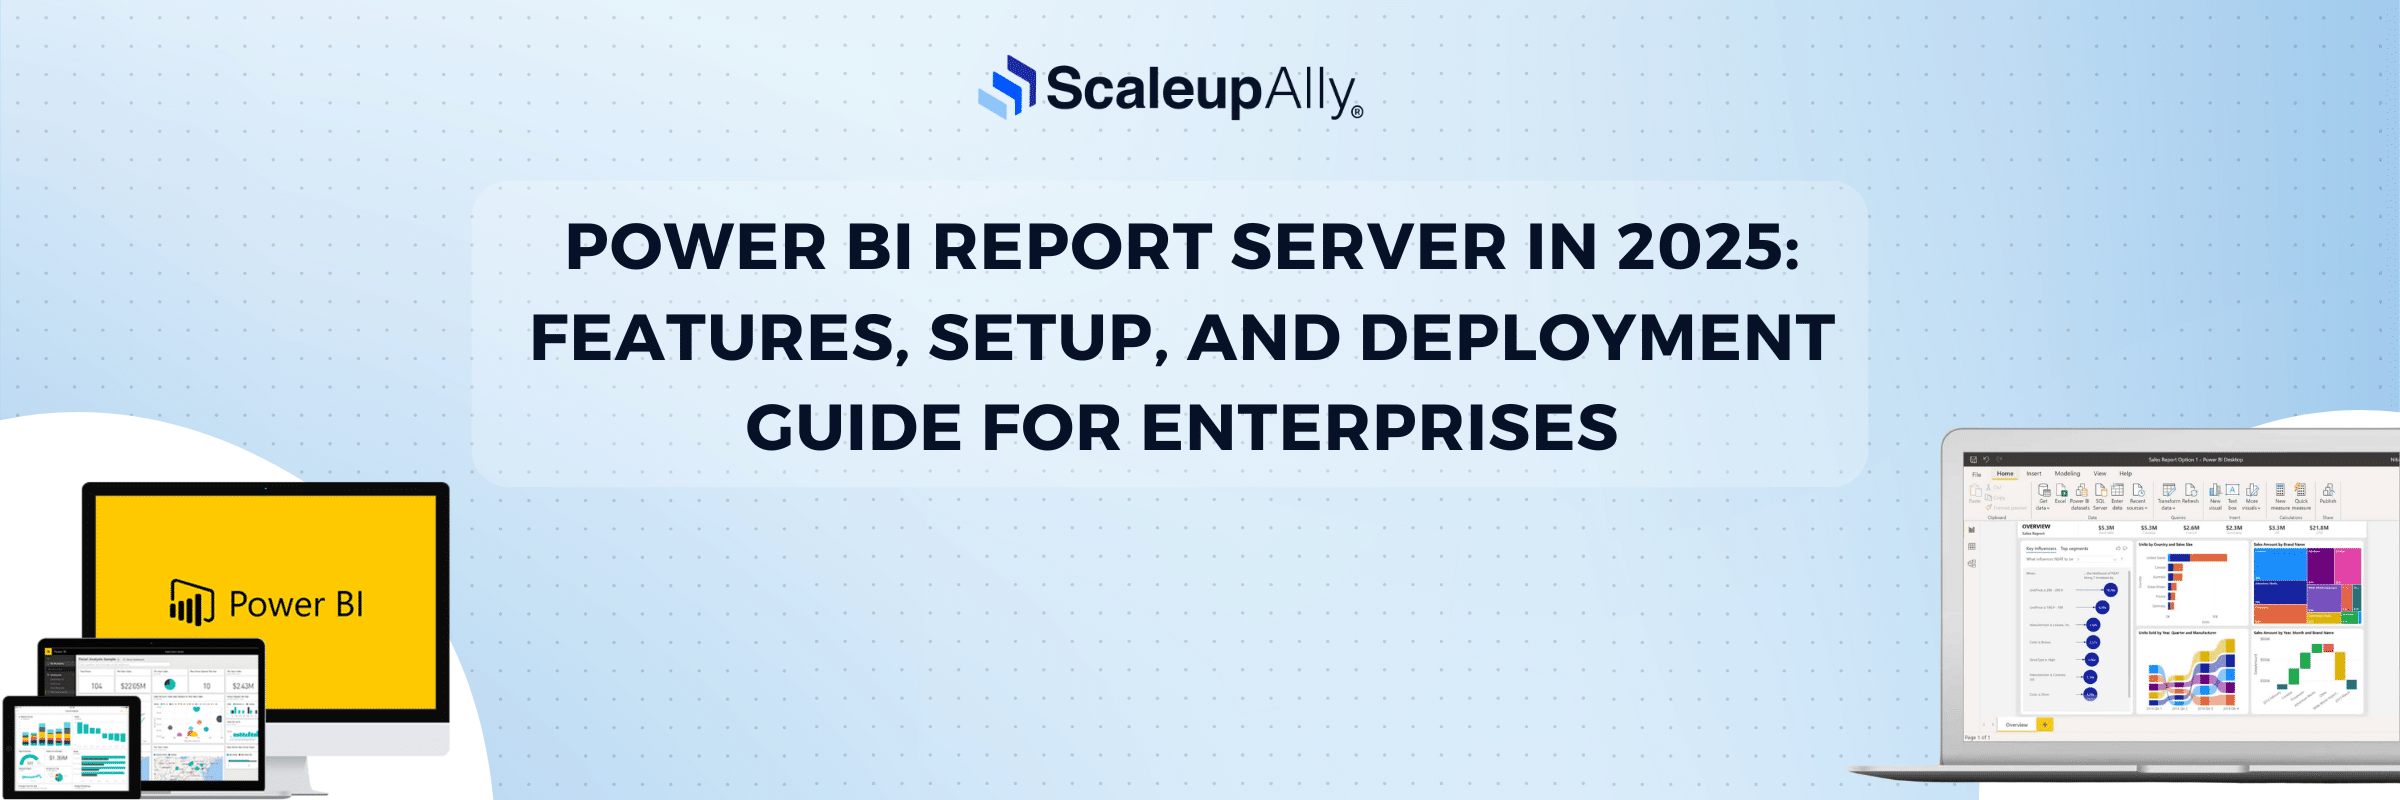
Power BI Report Server in 2025: Features, Setup, and Deployment Guide for Enterprises
Tarsem Singh | June 28, 2025 , 17 min read
Table Of Content
Most enterprises discover that they’ve previously been doing everything wrong when they finally implement a proper business intelligence infrastructure. This comes after years of scattered Excel files, fragmented dashboards, and decision-making based on gut feelings.
Power BI Report Server is Microsoft’s answer to this chaos. Updates as of May 2025 indicate that better tools for organizing and showing data have been added. Meaning it’s not just another reporting tool thrown into an oversaturated market.
However, just because the software is more advanced doesn’t mean it’s easier to set up. Many teams struggle to turn powerful features into real-world results. This guide is here to help with that. We will offer clear, practical steps for using Power BI Report Server in a way that works for your business.
Key Takeaways
- Power BI Report Server is Microsoft’s on-premises alternative to cloud-based Power BI, designed for organizations that need complete data control due to security, compliance, or regulatory requirements.
- The main business drivers include data sovereignty needs, network independence during outages, and cost predictability for large organizations with hundreds of users.
- You need Windows Server 2016+, SQL Server for the database, adequate hardware resources, and careful consideration of network connectivity and security configurations to install Power BI Report Server.
- Deployment success depends on realistic capacity planning rather than guesswork, plus proper Active Directory integration and role-based security that matches your actual business workflow.
What is Power BI Report Server?
Power BI Report Server is Microsoft’s answer to a fundamental enterprise problem: how do you deliver modern business intelligence without surrendering control of your data?
Power BI Report Server is an on-premises report server with a web portal where you display and manage reports and KPIs. Along with it come the tools to create Power BI reports, paginated reports, mobile reports, and KPIs.
Key Features of Power BI Report Server
- Unified Report Management
Organizations typically struggle with report sprawl, as dozens of different tools create hundreds of reports scattered across network drives, email attachments, and various departmental systems. Power BI Report Server consolidates this mess into a single, manageable platform.
The web portal organizes content through a traditional folder hierarchy that IT administrators understand instinctively. But instead of maintaining separate permissions for different reporting tools, administrators define role-based access once and apply it consistently across all report types.
- Advanced Visualization Capabilities
We have a number of exciting updates, including enhancements to modeling and visualization capabilities in the latest 2025 releases.
The Financial Reporting Matrix now with comments! feature addresses a critical enterprise need: collaborative analysis without losing audit trails. Finance teams can annotate complex reports directly, maintaining context that email discussions inevitably lose.
Dynamic format strings for measures provide flexibility. Business users can switch between different number formats, currencies, or time periods without requiring IT intervention to rebuild reports.
- Mobile-First Design
Mobile reports connect to on-premises data and have a responsive layout that adapts to different devices and the different ways you hold them. This responsive design philosophy extends beyond simple screen size adjustments.
The mobile experience maintains full functionality rather than providing watered-down “mobile views” that force users back to desktop computers for serious work. Executives can drill through complex financial data, apply filters, and analyze trends from any device without sacrificing analytical depth.
- Automated Scheduling
Report subscriptions deliver critical information automatically without requiring manual intervention. But the real innovation lies in data-driven subscriptions that customize content based on recipient requirements. Sales reports automatically filter to show only relevant territories. Financial reports adjust currency and formatting based on recipient location.
Email delivery, file share distribution, and SharePoint integration ensure reports reach users through their preferred channels. This flexibility eliminates the “last mile” problem that often derails enterprise reporting initiatives.
Why Do Businesses Need a Power BI Report Server?
Here are some compelling reasons why your organization needs a Microsoft Power BI report server
1. Data Security
Organizations or companies that deal with sensitive information or data that is extremely vulnerable, for instance, banking industries, benefit from the on-premise setting, for it provides maximum security to their data. Financial institutions handling PCI DSS compliance, healthcare organizations managing HIPAA requirements, and government agencies dealing with classified data can’t simply upload everything to the cloud and hope for the best.
Power BI Service further extended the capabilities by providing a robust report hosting cloud-based SaaS platform through which reports can be easily shared with colleagues for collaboration and made more accessible. However, if your organisation has an on-premises setup and doesn’t want to set up a Gateway to expose the reports to the cloud, then Power BI Service can’t be used for hosting reports, and an OnPremises hosting server would be required.
2. Economic Reasons
While cloud advocates focus on reducing upfront costs, they often ignore the long-term financial implications. You get an affordable and enterprise grade reporting solution without paying recurring costs for cloud-based Power BI reporting services. If you already have Power BI Premium subscription, you can access Power BI reporting server without any additional licensing fees.
Consider a mid-sized enterprise with 500 users requiring monthly reports. Cloud licensing costs compound annually, while on-premises infrastructure represents a one-time investment that scales predictably. Power BI premium users get the right to install and use the PowerBI report server, which a P1 costs $5000/ month. For organizations already invested in Power BI Premium or SQL Server Enterprise licensing, Report Server becomes essentially free additional capability.
3. Performance
Network latency is a business killer. When executives need real-time dashboards during board meetings, waiting for cloud responses isn’t acceptable. The on-premise structure of computing provides maximum control over the data of the user organization, including performance optimization that matches specific business requirements.
Key Elements of a Power BI Report Server
A Power BI Report Server is an assembly of interconnected components that work together to deliver enterprise analytics. Understanding the components that make up a Power BI report server helps organizations plan their deployment strategy and avoid common implementation pitfalls.
1. Web Service
The report server web service handles all client interactions, from simple report viewing to complex administrative tasks. This middle-tier component processes authentication requests, manages concurrent user sessions, and coordinates between the web portal interface and the underlying database.
Performance at this layer determines user experience across the entire platform. Insufficient memory allocation creates response delays that frustrate business users. Inadequate processor capacity causes timeouts during peak usage periods. Network configuration errors prevent mobile devices from accessing reports reliably.
2. Power BI Desktop for Report Server
To begin with, the Power BI desktop for the Power BI Report Server needs to be installed. Both Power BI Desktop and Power BI Desktop for on-premises report server can run on the same computer. This specialized version of Power BI Desktop creates reports specifically designed for on-premises deployment.
The distinction matters more than most organizations realize. Reports created with standard Power BI Desktop often use cloud-exclusive features that won’t function in on-premises environments. You cannot use the PowerBI.com cloud version of Desktop to publish to PBIRS Report Server since they are different products on different versions. The PowerBI.com cloud version has features that are not available in PBIRS Report Server.
3. The Licensing Architecture
Power BI Report Server operates on a core-based licensing model and is currently available through three different licenses: Fabric F64+ reserved instances, SQL Server Enterprise Edition with Software Assurance, or SQL Server Enterprise Subscriptions. This licensing structure determines not just cost, but available functionality and scalability limits.
Fabric F64+ licensing provides the most features but requires specific capacity planning. SQL Server Enterprise licensing leverages existing investments but limits certain advanced features.
Advantages and Disadvantages of Power BI Report Server
Every enterprise technology decision involves trade-offs, but Power BI Report Server presents a particularly complex set of advantages and limitations that don’t fit neatly into standard cloud-versus-on-premises comparisons. Understanding these prevents costly implementation mistakes and unrealistic expectations.
Advantages
1. Superior Performance Control
The on-premise structure of computing provides maximum control over the data of the user organization, including performance optimization that cloud solutions can’t deliver. Network latency disappears when reports access local data sources. Processing power scales based on organizational requirements rather than cloud provider capacity limitations.
Executive dashboards load instantly during board meetings. Complex financial reports are generated without waiting for cloud processing queues. Real-time manufacturing data appears without internet connectivity dependencies. This performance predictability becomes critical when analytics support time-sensitive business decisions.
2. Complete Infrastructure Ownership
Organizations maintain absolute control over hardware specifications, network configurations, and deployment schedules. IT teams can optimize server configurations for specific workloads. Database tuning addresses particular performance bottlenecks. Backup strategies align with existing disaster recovery procedures.
Service level agreements become internal commitments rather than external dependencies. Maintenance windows align with business schedules rather than vendor convenience. Upgrade timing matches organizational readiness rather than cloud provider schedules.
3. Regulatory Compliance Simplified
Many compliance frameworks explicitly require on-premises data processing. HIPAA regulations often prohibit cloud storage of patient information. Financial industry requirements mandate specific data residency. Government contracts frequently include clauses that exclude cloud deployment options.
Power BI Report Server eliminates the complex compliance assessments that cloud deployments require. Auditors can inspect physical security measures directly. Data sovereignty concerns disappear when information never leaves organizational premises.
Disadvantages
1. Significant Feature Lag
One of the main drawbacks of the Power BI Report Server is its isolation from the Power BI Service. You won’t get great features of the Power BI website on the Report Server. This isolation eliminates some of the most compelling reasons organizations adopt modern BI platforms.
Q&A natural language queries that let business users ask questions in plain English remain cloud-exclusive. Automatic insights that identify trending patterns and anomalies don’t work in on-premises deployments. Real-time collaboration features that enable teams to annotate and discuss reports together require cloud connectivity.
The SaaS version is completely managed and updated regularly, whereas the on-premise solution is updated three times a year. This update frequency creates a constant feature lag that compounds over time.
2. Scalability Limitations
Fixed issue with models loading in scale out environment highlights the scaling challenges that enterprise deployments face. While Power BI Report Server supports scale-out configurations, the architecture doesn’t match cloud elasticity.
Adding processing capacity requires hardware procurement, installation, and configuration cycles measured in weeks rather than minutes. User adoption spikes during month-end reporting periods can overwhelm fixed infrastructure capacity. Geographic distribution requires multiple server deployments rather than global content delivery networks.
3. Mobile Access Complications
Mobile reports connect to on-premises data and have a responsive layout that adapts to different devices and the different ways you hold them. But mobile access to on-premises systems introduces network complexity that cloud solutions avoid.
VPN connections required for external mobile access create performance bottlenecks and security vulnerabilities. Corporate network policies often block mobile device access to internal systems. The mobile experience that works seamlessly in office environments often fails when executives need access from airports, hotels, or client locations.
How to Install and Use the Power BI Report Server
Many organizations rush through setup without properly preparing their environment, leading to performance issues and security gaps later. Getting the foundation right during installation saves countless hours of troubleshooting and rebuilds down the road.
System Requirements and Prerequisites
- Your server needs Windows Server 2016 or later with at least 8GB of RAM, though 16GB performs noticeably better under heavy loads. SQL Server 2016 Database Engine or newer must be installed separately. Don’t skimp on storage either; report caching and temporary files can consume surprising amounts of disk space as your user base grows.
- Network connectivity requirements often catch organizations off guard. The server needs consistent access to any data sources your reports will use, plus reliable connectivity for users accessing the web portal. Firewall configurations must allow traffic on the ports you configure during setup, typically 80 and 443 for web access.
Step-by-Step Installation Process
- Download the installation media from Microsoft’s Volume Licensing Service Center or your Software Assurance benefits portal. The installer walks you through choosing between native mode and SharePoint integrated mode (most organizations should stick with native mode unless they have specific SharePoint requirements).
- Create the report server database during installation by pointing to your SQL Server instance. The setup wizard handles database creation automatically, but you’ll need administrative rights on the SQL Server. Choose strong service account credentials that follow your organization’s security policies; these accounts will run the report server services continuously.
- Configure the web service URL and web portal URL during setup. Many administrators accept the defaults here, but consider how users will actually access the system. Friendly URLs improve user adoption significantly compared to cryptic server names and port numbers.
Initial Configuration and Setup
- After installation completes, the Report Server Configuration Manager becomes your primary tool for fine-tuning the environment. Configure email settings if you plan to deliver reports automatically—this requires SMTP server details and appropriate authentication credentials.
- Set up your first data source connection to verify everything works correctly. Test with a simple connection to a SQL Server database or file share before attempting more complex data source types. This early testing catches configuration issues while they’re still easy to fix.
- Upload a sample report from Power BI Desktop to confirm that the entire pipeline functions properly. The upload process reveals potential permission issues or missing components before users start depending on the system for critical business reports.
Deploying Power BI Report Server
Deployment strategy determines whether your reporting infrastructure becomes a reliable business asset or a constant source of IT headaches.
1. Environment Planning and Architecture Design
Start by mapping your actual reporting workload instead of guessing at capacity requirements. How many concurrent users will access reports during peak business hours? Which reports contain the most complex calculations or the largest datasets? These answers drive hardware specifications and network bandwidth planning more accurately than generic sizing guides.
Consider your disaster recovery requirements early in the planning phase. Business continuity plans should include both the report server infrastructure and the underlying databases it depends on. Many organizations discover too late that their backup procedures don’t account for report server configuration settings and custom content.
2. Security Configuration and User Management
Active Directory integration simplifies user management but requires careful planning of security groups and permissions. Create dedicated security groups for different report access levels rather than assigning permissions to individual users. This approach scales better and reduces administrative overhead when employees change roles or departments.
Configure role-based security that matches your organization’s actual workflow patterns. The default security roles may not align with how your business operates. Custom roles often provide better security and user experience than trying to force standard roles into inappropriate scenarios.
Data source security deserves special attention during deployment. Service accounts used for data connections should follow the principle of least privilege. They need sufficient access to retrieve data, but nothing more. Overprivileged service accounts create unnecessary security risks that auditors will eventually discover.
3. Performance Optimization and Scaling
Report server performance depends heavily on the underlying SQL Server database configuration. Ensure the report server database has adequate memory allocation and proper indexing. Many performance problems trace back to database configuration issues rather than the report server itself.
Configure caching policies that balance performance with data freshness requirements. Heavily accessed reports with relatively stable data should be cached aggressively, while real-time dashboards need different caching strategies. The optimal configuration varies significantly between organizations and even between different reports within the same organization.
Monitor resource utilization patterns during the first few weeks of production use. Initial usage patterns often differ from long-term patterns as users discover new ways to leverage the reporting capabilities. Plan for capacity expansion based on observed growth trends rather than linear projections.
Conclusion
Power BI Report Server isn’t right for every organization, but it’s essential for those prioritizing data control over cloud convenience. The decision ultimately comes down to your security requirements, existing infrastructure, and long-term business intelligence strategy.
Ready to evaluate whether Power BI Report Server fits your enterprise needs? Contact us today for a personalized consultation and deployment roadmap tailored to your organization’s unique requirements.
Frequently Asked Questions
Q: What is Power BI Report Server used for?
Power BI Report Server serves as an on-premises business intelligence platform for organizations that need to keep their data within their own infrastructure. It’s primarily used for creating, hosting, and sharing interactive dashboards, paginated reports, and KPIs without sending data to Microsoft’s cloud servers. Companies in regulated industries like healthcare, finance, and government use it to comply with data residency requirements while still accessing modern analytics capabilities.
Q: How is Power BI Report Server licensed?
The licensing is included with SQL Server Enterprise Edition with Software Assurance, or it can be purchased as a standalone license. Each license covers unlimited users accessing reports through the web portal, making it cost-effective for large organizations. The licensing model is based on server cores rather than individual user counts, which simplifies budgeting for enterprises with extensive reporting needs.
Q: Is Power BI Report Server free?
No, Power BI Report Server is not free. However, if your organization already has SQL Server Enterprise Edition with Software Assurance, the report server is included at no additional cost. For organizations without existing SQL Server Enterprise licensing, Microsoft offers standalone licensing options. There’s also a free evaluation version available for testing purposes, but production use requires proper licensing.
Q: How do I connect Power BI to a server?
Connection happens through Power BI Desktop for Report Server, which is a specialized version of the standard Power BI Desktop tool. After creating your reports in this version, you publish them directly to the report server through the built-in publishing feature. Users then access these reports through the web portal using their standard web browsers. The server handles all the data connections, security, and report rendering automatically once everything is properly configured.
Related Blogs
Power BI for Inventory Management: A Comprehensive Guide
Explore the hidden power of Power BI for inventory management and how it provides businesses with powerful analytics and visualization capabilities.
Tarsem Singh
Oct 8 ,
19 min read

How Integration is Evolving in 2025: 9 Key Trends Businesses Must Follow
Discover key integration trends in 2025 that will shape the future of connected systems, improve workflows, and drive business growth.
Tarsem Singh
Aug 29 ,
7 min read

Future of Power BI: Emerging Trends Revolutionizing Data Visualization and Analytics
Explore the key travel apps trends in 2025. Learn about the current market overview of travel apps along with its future in the coming years.
Tarsem Singh
Aug 29 ,
7 min read
